OPEN-SOURCE SCRIPT
SwiftEdge Mentor - Structure, Volume Profile and Open Interest
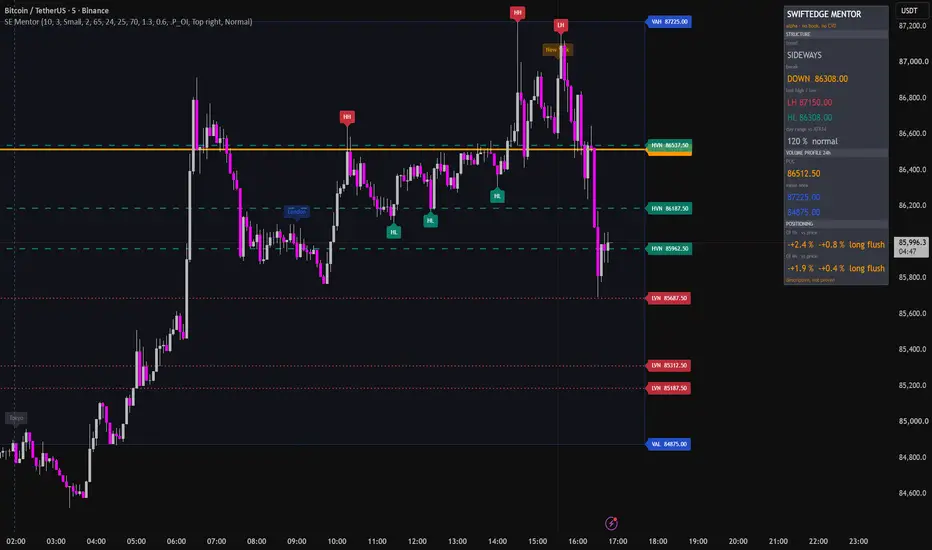
WHAT IT DOES
A read-only market map. It draws three things and reports them in one side
panel: market structure, a volume profile, and how open interest is moving
against price. It gives no entries, no exits and no signals.
HOW IT WORKS
Structure. Swing highs and lows are pivots with a configurable number of bars on
each side, three by default. Only the last three of each are kept and labelled
HH, HL, LH or LL, and the trend is read from the newest pair: higher highs with
higher lows is up, lower highs with lower lows is down, anything else is
sideways. A structure break is flagged when price trades beyond the last swing
while that swing was not already the continuation label. Impulse legs are bars
whose range exceeds two times the median range of the last 96 bars and whose
body is at least 65 percent of that range. Daily ATR is Wilder 14 on completed
daily bars only, and the panel shows today's range as a percentage of it, so a
day that has already travelled twice its normal distance is marked as stretched.
Session opens are drawn for Tokyo, London and New York in their own time zones.
Volume profile. Each bar's volume is spread evenly across the price bins its
high-low range covers, over a configurable window, 24 hours and 25 dollar bins
by default. The point of control is the heaviest bin. The value area grows
outwards from it, always taking the larger of the two neighbouring bins, until
it holds 70 percent of the total volume. High and low volume nodes are local
extremes of a five-bin smoothing measured against the median of the profile, and
the three nearest to current price are drawn with their prices labelled.
Open interest. Open interest is read from the exchange's own feed and compared
with price over one hour and four hours. Rising open interest with rising price
is new longs, rising open interest with falling price is new shorts, falling
open interest with rising price is a short squeeze, and falling open interest
with falling price is a long flush. The ticker is derived from the chart's own
symbol, so this works on any instrument where the exchange publishes open
interest. Where it does not, the block reads "no OI feed" and everything else
continues to work.
HOW TO USE IT
Put it on a chart and read the panel. The structure block says what the market
has done, the volume profile says where it has spent its volume, and the
positioning block says whether a move is being funded by new positions or caused
by old ones closing. Run it on a 1 minute chart if you want the volume profile
at its finest resolution; on higher timeframes each bar's volume is distributed
across its own range instead, which the 25 dollar binning largely absorbs.
Five alerts are available: structure break up, structure break down, price left
the value area, price entered the value area, and open interest regime changed.
WHAT IT DOES NOT DO
It does not see the order book. Resting limit orders that never trade leave no
trace in price or volume, so standing liquidity cannot be reconstructed from
what a chart provides. This was measured rather than assumed: on three hours of
recorded order book data, ranking price levels by traded volume found 40 percent
of the ten largest resting walls, where picking levels at random finds 23
percent, and an absorption metric found none of them. A liquidity layer is
therefore absent rather than approximated.
It has no cumulative volume delta either. The taker side of each trade is not
available to a chart script, and inferring it from bar direction is a different
measurement: against recorded trades carrying the real taker flag, the sign of
close minus open times volume correlates 0.71 per bar on one minute data and
0.65 on one second data, where one second is worse because 36 percent of seconds
close unchanged and get no direction at all. Since the usual purpose of such a
line is divergence at swing points, where single bars decide the answer, a 0.71
proxy would produce divergences the full data does not show. It is left out.
It is descriptive. It reports what has happened. It makes no claim about what
happens next, and no performance claim of any kind.
ORIGINALITY
Structure labelling, volume profiles and open interest readings each exist
separately. This combines the three into one panel under a single consistent set
of definitions, and states plainly which parts of a full order flow picture a
chart script cannot provide, with the measurements behind that statement
included in the code comments rather than asserted.
REPAINTING
Pivots confirm after the configured number of bars on each side and do not move
afterwards. Daily values are taken from completed daily bars only. The volume
profile and the panel show the current state and are redrawn on the last bar,
so they reflect the present rather than a history of past states. The two value
area alerts evaluate on the last bar and therefore do nothing on historical
bars.
A read-only market map. It draws three things and reports them in one side
panel: market structure, a volume profile, and how open interest is moving
against price. It gives no entries, no exits and no signals.
HOW IT WORKS
Structure. Swing highs and lows are pivots with a configurable number of bars on
each side, three by default. Only the last three of each are kept and labelled
HH, HL, LH or LL, and the trend is read from the newest pair: higher highs with
higher lows is up, lower highs with lower lows is down, anything else is
sideways. A structure break is flagged when price trades beyond the last swing
while that swing was not already the continuation label. Impulse legs are bars
whose range exceeds two times the median range of the last 96 bars and whose
body is at least 65 percent of that range. Daily ATR is Wilder 14 on completed
daily bars only, and the panel shows today's range as a percentage of it, so a
day that has already travelled twice its normal distance is marked as stretched.
Session opens are drawn for Tokyo, London and New York in their own time zones.
Volume profile. Each bar's volume is spread evenly across the price bins its
high-low range covers, over a configurable window, 24 hours and 25 dollar bins
by default. The point of control is the heaviest bin. The value area grows
outwards from it, always taking the larger of the two neighbouring bins, until
it holds 70 percent of the total volume. High and low volume nodes are local
extremes of a five-bin smoothing measured against the median of the profile, and
the three nearest to current price are drawn with their prices labelled.
Open interest. Open interest is read from the exchange's own feed and compared
with price over one hour and four hours. Rising open interest with rising price
is new longs, rising open interest with falling price is new shorts, falling
open interest with rising price is a short squeeze, and falling open interest
with falling price is a long flush. The ticker is derived from the chart's own
symbol, so this works on any instrument where the exchange publishes open
interest. Where it does not, the block reads "no OI feed" and everything else
continues to work.
HOW TO USE IT
Put it on a chart and read the panel. The structure block says what the market
has done, the volume profile says where it has spent its volume, and the
positioning block says whether a move is being funded by new positions or caused
by old ones closing. Run it on a 1 minute chart if you want the volume profile
at its finest resolution; on higher timeframes each bar's volume is distributed
across its own range instead, which the 25 dollar binning largely absorbs.
Five alerts are available: structure break up, structure break down, price left
the value area, price entered the value area, and open interest regime changed.
WHAT IT DOES NOT DO
It does not see the order book. Resting limit orders that never trade leave no
trace in price or volume, so standing liquidity cannot be reconstructed from
what a chart provides. This was measured rather than assumed: on three hours of
recorded order book data, ranking price levels by traded volume found 40 percent
of the ten largest resting walls, where picking levels at random finds 23
percent, and an absorption metric found none of them. A liquidity layer is
therefore absent rather than approximated.
It has no cumulative volume delta either. The taker side of each trade is not
available to a chart script, and inferring it from bar direction is a different
measurement: against recorded trades carrying the real taker flag, the sign of
close minus open times volume correlates 0.71 per bar on one minute data and
0.65 on one second data, where one second is worse because 36 percent of seconds
close unchanged and get no direction at all. Since the usual purpose of such a
line is divergence at swing points, where single bars decide the answer, a 0.71
proxy would produce divergences the full data does not show. It is left out.
It is descriptive. It reports what has happened. It makes no claim about what
happens next, and no performance claim of any kind.
ORIGINALITY
Structure labelling, volume profiles and open interest readings each exist
separately. This combines the three into one panel under a single consistent set
of definitions, and states plainly which parts of a full order flow picture a
chart script cannot provide, with the measurements behind that statement
included in the code comments rather than asserted.
REPAINTING
Pivots confirm after the configured number of bars on each side and do not move
afterwards. Daily values are taken from completed daily bars only. The volume
profile and the panel show the current state and are redrawn on the last bar,
so they reflect the present rather than a history of past states. The two value
area alerts evaluate on the last bar and therefore do nothing on historical
bars.
สคริปต์แบบโอเพนซอร์ส
ด้วยเจตนารมณ์หลักของ TradingView ผู้สร้างสคริปต์นี้ได้ทำให้เป็นโอเพนซอร์ส เพื่อให้เทรดเดอร์สามารถตรวจสอบและยืนยันฟังก์ชันการทำงานของมันได้ ขอชื่นชมผู้เขียน! แม้ว่าคุณจะใช้งานได้ฟรี แต่โปรดจำไว้ว่าการเผยแพร่โค้ดซ้ำจะต้องเป็นไปตาม กฎระเบียบการใช้งาน ของเรา

Order-flow and session tooling for BTC — swiftedge.uk/depth
คำจำกัดสิทธิ์ความรับผิดชอบ
ข้อมูลและบทความไม่ได้มีวัตถุประสงค์เพื่อก่อให้เกิดกิจกรรมทางการเงิน, การลงทุน, การซื้อขาย, ข้อเสนอแนะ หรือคำแนะนำประเภทอื่น ๆ ที่ให้หรือรับรองโดย TradingView อ่านเพิ่มเติมใน ข้อกำหนดการใช้งาน
สคริปต์แบบโอเพนซอร์ส
ด้วยเจตนารมณ์หลักของ TradingView ผู้สร้างสคริปต์นี้ได้ทำให้เป็นโอเพนซอร์ส เพื่อให้เทรดเดอร์สามารถตรวจสอบและยืนยันฟังก์ชันการทำงานของมันได้ ขอชื่นชมผู้เขียน! แม้ว่าคุณจะใช้งานได้ฟรี แต่โปรดจำไว้ว่าการเผยแพร่โค้ดซ้ำจะต้องเป็นไปตาม กฎระเบียบการใช้งาน ของเรา
Order-flow and session tooling for BTC — swiftedge.uk/depth
คำจำกัดสิทธิ์ความรับผิดชอบ
ข้อมูลและบทความไม่ได้มีวัตถุประสงค์เพื่อก่อให้เกิดกิจกรรมทางการเงิน, การลงทุน, การซื้อขาย, ข้อเสนอแนะ หรือคำแนะนำประเภทอื่น ๆ ที่ให้หรือรับรองโดย TradingView อ่านเพิ่มเติมใน ข้อกำหนดการใช้งาน