ที่อัปเดต:
DW-MTF-Close Price(1W/3D) as Support Line
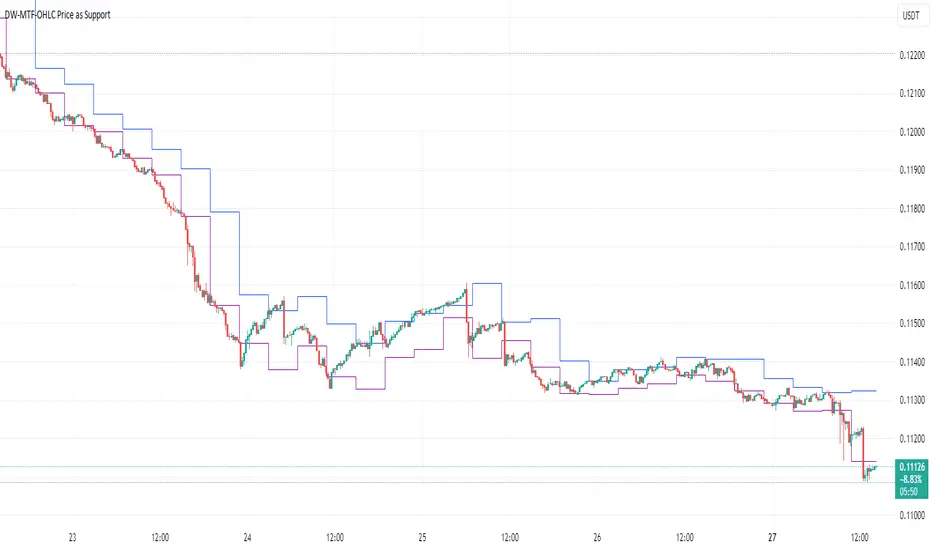
This simple study shows closing price of [up to 2] higher timeframes on your chart. Be sure to use a lower timeframe on your chart itself.
Release Note
Repainting RemovedRelease Note
Updated according to rules (RSI's removed). Code cleaned up.Release Note
This Indicator has been enhanced.In the past, only Close price could used for the 2 support lines. With this update it is possible to select source - Open, High, Low, Close etc. This is especially useful for tracking price movements on e.g. 15m within 4h low and high support lines.
Example 1:
Support line 1 - 1 DAY close
Support line 2 - 3 DAY close
2 support lines for buying and selling above/below.
Example 2:
Support line 1 - 4h LOW
Support line 2 - 4H HIGH
If your current timeframe on chart is 15m, track the prices changes within the LOW/HIGH of 4h
Release Note
Default colors changed to blue and purple 
คำจำกัดสิทธิ์ความรับผิดชอบ
ข้อมูลและบทความไม่ได้มีวัตถุประสงค์เพื่อก่อให้เกิดกิจกรรมทางการเงิน, การลงทุน, การซื้อขาย, ข้อเสนอแนะ หรือคำแนะนำประเภทอื่น ๆ ที่ให้หรือรับรองโดย TradingView อ่านเพิ่มเติมใน ข้อกำหนดการใช้งาน
คำจำกัดสิทธิ์ความรับผิดชอบ
ข้อมูลและบทความไม่ได้มีวัตถุประสงค์เพื่อก่อให้เกิดกิจกรรมทางการเงิน, การลงทุน, การซื้อขาย, ข้อเสนอแนะ หรือคำแนะนำประเภทอื่น ๆ ที่ให้หรือรับรองโดย TradingView อ่านเพิ่มเติมใน ข้อกำหนดการใช้งาน