OPEN-SOURCE SCRIPT
ที่อัปเดต: MTF RSI & SMA Crossover [OB/OS Filtered Signals]
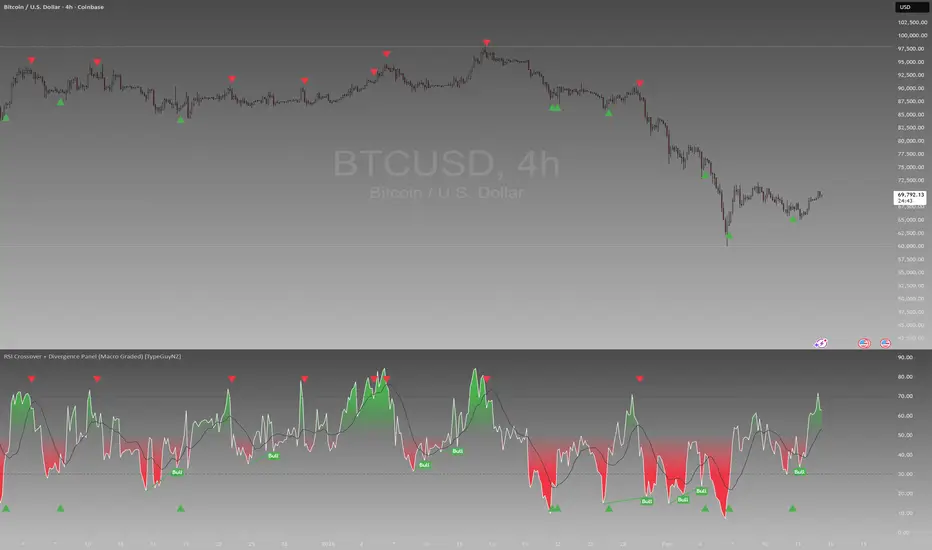
MTF RSI & SMA Crossover [OB/OS Filtered Signals]
This custom indicator combines the power of Multi-Timeframe (MTF) RSI, Simple Moving Average (SMA), and overbought/oversold (OB/OS) conditions to provide precise buy and sell signals based on the crossovers of the RSI and its SMA. The indicator includes the following features:
MTF RSI: The Relative Strength Index (RSI) is calculated on a customizable timeframe, giving traders the ability to analyze price momentum across different timeframes.
SMA of RSI: The RSI is smoothed using a Simple Moving Average (SMA), helping to filter out market noise and identify clearer trend reversals.
Overbought/Oversold Filter: Signals are only triggered when the RSI has been in an overbought (above 70) or oversold (below 30) condition, improving the reliability of potential trend reversals.
Buy/Sell Signals:
Buy signals occur when the RSI crosses above its SMA after being oversold, indicating potential upward momentum.
Sell signals occur when the RSI crosses below its SMA after being overbought, indicating potential downward momentum.
Customizable Label Colors: Choose your own colors for the "BUY" and "SELL" labels to match your chart's design and preferences.
Alerts: Set alerts for buy and sell signals, ensuring you don't miss a potential trade.
This indicator is ideal for traders who want to capture trend reversals and momentum shifts while filtering out false signals by using overbought and oversold conditions. Customize the settings to suit your trading style and strategy.
Release Note
🔍 Indicator Description for TradingView:MTF RSI & RSI-MA Crossover [OB/OS Filtered Signals]
This indicator provides clean, high-probability buy and sell signals based on RSI crossovers filtered by overbought/oversold conditions. It's designed for traders who want precision entries with minimal chart clutter.
📈 Core Features:
Multi-Timeframe RSI: Choose your preferred timeframe to align with your trading strategy.
RSI-Based Moving Average: Detect momentum shifts by tracking RSI crosses above/below its moving average.
OB/OS Filtering:
Buy Signals appear only when RSI has moved into oversold territory and then crosses above its MA.
Sell Signals appear only when RSI has entered overbought territory and then crosses below its MA.
Custom OB/OS Levels: Set your own overbought and oversold thresholds (default: 70/30).
Minimalist Display: Only directional triangle markers are shown directly on the price chart — no unnecessary lines or clutter.
Supports Alerts: Alerts can be set for both buy and sell conditions for automation or notifications.
⚡️ Best Use:
Combine with price action or trend analysis for confirmation.
Works well in both trending and ranging environments with proper tuning.
Ideal for scalping, swing trading, or multi-timeframe confirmation strategies.
Release Note
🔍 Indicator Description for TradingView:See chart for additional information and what to look for.
MTF RSI & RSI-MA Crossover [OB/OS Filtered Signals]
This indicator provides clean, high-probability buy and sell signals based on RSI crossovers filtered by overbought/oversold conditions. It's designed for traders who want precision entries with minimal chart clutter.
📈 Core Features:
Multi-Timeframe RSI: Choose your preferred timeframe to align with your trading strategy.
RSI-Based Moving Average: Detect momentum shifts by tracking RSI crosses above/below its moving average.
OB/OS Filtering:
Buy Signals appear only when RSI has moved into oversold territory and then crosses above its MA.
Sell Signals appear only when RSI has entered overbought territory and then crosses below its MA.
Custom OB/OS Levels: Set your own overbought and oversold thresholds (default: 70/30).
Minimalist Display: Only directional triangle markers are shown directly on the price chart — no unnecessary lines or clutter.
Supports Alerts: Alerts can be set for both buy and sell conditions for automation or notifications.
⚡️ Best Use:
Combine with price action or trend analysis for confirmation.
Works well in both trending and ranging environments with proper tuning.
Ideal for scalping, swing trading, or multi-timeframe confirmation strategies.
Release Note
📌 Indicator TitleMTF RSI & RSI-based MA Crossover [OB/OS Confirmed Signals]
📄 Description
This indicator generates high-probability buy and sell signals based on a multi-timeframe RSI and a moving average of the RSI (customizable type and length). Signals are only triggered when:
RSI enters the Overbought (OB) or Oversold (OS) zone.
Then exits the OB or OS zone (indicating a momentum shift).
Then the RSI crosses its own moving average — this confirms the reversal.
Only after all three steps are complete does a Buy (triangle up) or Sell (triangle down) signal appear on the chart.
This filtering eliminates noise and false signals that often occur during normal RSI swings, focusing on true momentum reversals.
⚙️ Features
✅ Customizable RSI settings: length, source, timeframe.
✅ Choose from 5 MA types: SMA, EMA, SMMA (RMA), WMA, VWMA.
✅ OB/OS levels are adjustable (default 70/30).
✅ Option to display on-chart Buy/Sell markers.
✅ Alert-ready with custom messages for both signals.
📈 How to Use
Add to chart → Click “Indicators” > “My Scripts” (if saved) or paste in Pine Editor and click "Add to Chart".
Open the settings gear ⚙️ to:
Adjust RSI length, timeframe, and OB/OS levels.
Choose your preferred RSI MA type and length.
Turn on/off Buy/Sell markers using the toggle.
Set alerts from the “Alerts” tab using the included conditions.
💡 Trading Strategy Suggestions
Pair this with price action, support/resistance, or volume analysis to confirm entries.
Works well on multiple timeframes — use a higher timeframe RSI (e.g., 1h on 5m chart) to reduce noise.
Release Note
📈 RSI Crossover + Divergence Panel by TypeGuyNZThis indicator combines a multi-purpose RSI crossover signal system with a dedicated RSI pane that visualizes:
RSI with dynamic gradient fills
RSI-based Moving Average (MA)
Overbought/Oversold zones
Automatic Bullish & Bearish Divergence detection
Buy/Sell triangle signals are also plotted directly on the main price chart, allowing for seamless signal visualization across assets and timeframes.
🔧 Features & How It Works
✅ Buy Signal
RSI drops below the oversold level (default: 30)
Turns upward and crosses above its RSI-based moving average (SMA by default)
A green triangle appears below the price candle
✅ Sell Signal
RSI rises above the overbought level (default: 70)
Turns downward and crosses below its RSI-based moving average
A red triangle appears above the price candle
These triangle signals are ideal for trend reversals, pullback entries, or confirmation for other strategies.
📊 RSI Pane (Subwindow)
The lower pane shows:
RSI (White Line)
RSI-based MA (Black Line)
OB/OS Levels (70 & 30)
Gradient fills to highlight overbought (green) and oversold (red) conditions
Optional Bullish and Bearish Divergence lines auto-detected and plotted over the RSI
This gives you deeper insight into market momentum, reversals, and hidden structure shifts.
⚙️ Customizable Inputs
RSI length & source
MA type: SMA, EMA, WMA, etc.
Show/Hide Buy/Sell Triangles
Toggle Divergence Detection
OB/OS thresholds
RSI Timeframe (multi-timeframe ready if extended)
🔔 Alerts
You can set TradingView alerts for:
Buy Signal (RSI crossing above MA after OS exit)
Sell Signal (RSI crossing below MA after OB exit)
Bullish Divergence
Bearish Divergence
🧪 Use Cases
Swing trading reversals
Oversold re-entries
Confirmation for price action setups
Divergence-based exits
✅ Final Notes
This script keeps RSI crossover logic and divergences together in a single script, with signals on the price chart and technical strength in the dedicated RSI pane.
You can turn each element on/off based on your preference using the style and input menus.
Release Note
Update - LTF - When the RSI and RSI MA cross in the OB or OS zone a signal will show.Release Note
Add feature to toggle signal on and off on price and on the RSI paneRelease Note
🔥 RSI Crossover + Divergence Panel (Macro Graded)By TypeGuyNZ
📌 What This Indicator Does
This is not a generic RSI crossover.
This script filters RSI MA crosses using strict Oversold / Overbought logic, and optionally grades signals using a macro risk model.
It is designed to remove mid-zone noise and only trigger when RSI behavior actually matters.
✅ Core Signal Logic (Clean + Structured)
Long Signals
A Buy only triggers when:
RSI has been in Oversold (< 30 by default)
RSI exits Oversold
RSI crosses above its MA
Cross happens:
Inside OS OR
Within X bars after exiting OS (default 12)
No mid-zone crosses.
No random signals.
Short Signals
A Sell only triggers when:
RSI has been in Overbought (> 70 by default)
RSI exits Overbought
RSI crosses below its MA
Cross happens:
Inside OB OR
Within X bars after exiting OB
🔁 Reset Logic
After a signal fires:
RSI must revisit OS/OB again before another signal can occur.
Re-entering a zone forces a fresh exit cycle.
This prevents spam and duplicate signals.
📊 What You See
On Price Chart
Green triangle = Buy
Red triangle = Sell
On RSI Pane
Matching arrows plotted at RSI level
Divergence detection (optional)
🧠 Macro Grade Module (Optional but Powerful)
When enabled, each signal is graded based on:
DXY trend
US10Y
Nasdaq
Credit spreads (HYG/LQD)
BTC vs SPX
Gold
Real yields (if available)
Financial conditions
ETHBTC
SOLBTC
TOTAL2 (optional)
Manual CPI / PMI / Labour inputs
Signals are graded:
A = Strong macro alignment
B = Acceptable
C = Weak environment
You can:
Filter alerts to A/B only
Display macro score on signals
Tune thresholds
This allows you to trade RSI signals in context of macro risk conditions.
⚙️ Inputs
You can adjust:
RSI length
MA type (SMA / EMA / RMA / WMA / VWMA)
OB/OS levels
Max bars allowed after exit
Divergence on/off
Macro grading on/off
Macro timeframe (D / W)
🎯 Best Use Case
This tool works best for:
Swing trading
4H / 1D setups
Risk-on / risk-off environment filtering
BTC / majors / strong alts
It is not designed for 1m scalping noise.
⚠️ Important
This is a structured RSI system — not a prediction tool.
Always combine with:
Market structure
HTF bias
Liquidity zones
Volume
Risk management
🔥 Why This Is Different
Most RSI crossover scripts:
Fire mid-zone
Repaint logic
Spam signals
Ignore macro environment
This one:
Enforces cycle logic
Resets correctly
Filters weak setups
Optionally grades environment strength
It’s built for traders who think in structure — not random indicator crosses.
Release Note
Tradingveiw restricted access to some bits causing a bug - Indicator is the same.สคริปต์แบบโอเพนซอร์ส
ด้วยเจตนารมณ์หลักของ TradingView ผู้สร้างสคริปต์นี้ได้ทำให้เป็นโอเพนซอร์ส เพื่อให้เทรดเดอร์สามารถตรวจสอบและยืนยันฟังก์ชันการทำงานของมันได้ ขอชื่นชมผู้เขียน! แม้ว่าคุณจะใช้งานได้ฟรี แต่โปรดจำไว้ว่าการเผยแพร่โค้ดซ้ำจะต้องเป็นไปตาม กฎระเบียบการใช้งาน ของเรา

คำจำกัดสิทธิ์ความรับผิดชอบ
ข้อมูลและบทความไม่ได้มีวัตถุประสงค์เพื่อก่อให้เกิดกิจกรรมทางการเงิน, การลงทุน, การซื้อขาย, ข้อเสนอแนะ หรือคำแนะนำประเภทอื่น ๆ ที่ให้หรือรับรองโดย TradingView อ่านเพิ่มเติมใน ข้อกำหนดการใช้งาน
สคริปต์แบบโอเพนซอร์ส
ด้วยเจตนารมณ์หลักของ TradingView ผู้สร้างสคริปต์นี้ได้ทำให้เป็นโอเพนซอร์ส เพื่อให้เทรดเดอร์สามารถตรวจสอบและยืนยันฟังก์ชันการทำงานของมันได้ ขอชื่นชมผู้เขียน! แม้ว่าคุณจะใช้งานได้ฟรี แต่โปรดจำไว้ว่าการเผยแพร่โค้ดซ้ำจะต้องเป็นไปตาม กฎระเบียบการใช้งาน ของเรา
คำจำกัดสิทธิ์ความรับผิดชอบ
ข้อมูลและบทความไม่ได้มีวัตถุประสงค์เพื่อก่อให้เกิดกิจกรรมทางการเงิน, การลงทุน, การซื้อขาย, ข้อเสนอแนะ หรือคำแนะนำประเภทอื่น ๆ ที่ให้หรือรับรองโดย TradingView อ่านเพิ่มเติมใน ข้อกำหนดการใช้งาน