Ultimate MACD Momentum Panel v2
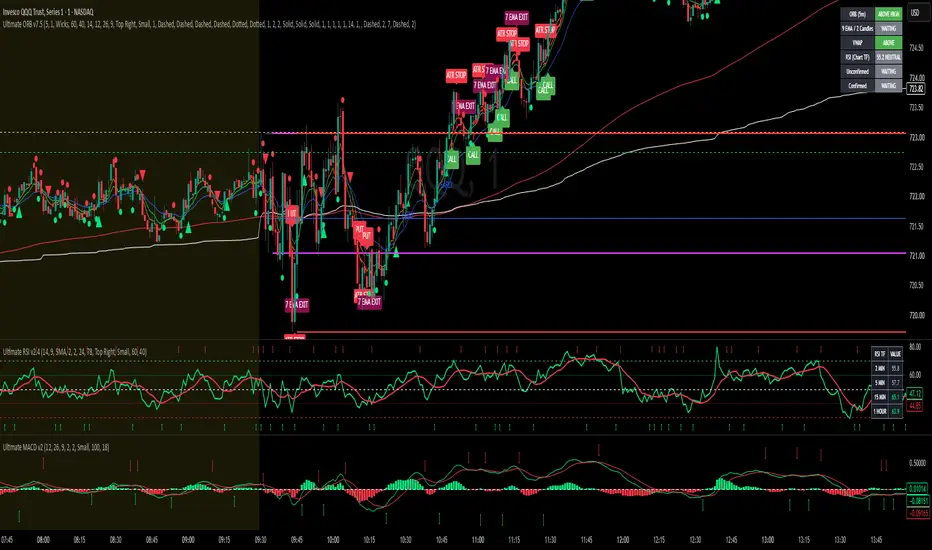
# ULTIMATE MACD MOMENTUM PANEL v2
## Complete User Guide and Symbol Legend
### PURPOSE
The Ultimate MACD Momentum Panel helps identify changes in bullish and bearish momentum.
MACD stands for Moving Average Convergence Divergence.
It compares two exponential moving averages and uses a signal line to highlight momentum changes.
Your MACD panel is separate from your main ORB chart.
**IMPORTANT: MACD IS NOT REQUIRED TO CONFIRM CALL OR PUT TRADES.**
### STANDARD SETTINGS
- Fast EMA: 12
- Slow EMA: 26
- Signal EMA: 9
- MACD line: Green
- Signal line: Red
- Histogram: Green/red
- Zero reference: White dashed
### MACD LINE LEGEND
🟢 **GREEN SOLID LINE — MACD**
Represents the difference between the fast 12 EMA and slow 26 EMA.
🔴 **RED SOLID LINE — SIGNAL**
A 9-period EMA of the MACD line.
⚪ **WHITE DASHED ZERO LINE**
A reference separating positive and negative MACD values.
When MACD is above zero, the 12 EMA is above the 26 EMA.
When MACD is below zero, the 12 EMA is below the 26 EMA.
### HISTOGRAM LEGEND
🟢 **GREEN HISTOGRAM BARS**
MACD is above its signal line.
This indicates bullish momentum relative to the signal line.
🔴 **RED HISTOGRAM BARS**
MACD is below its signal line.
This indicates bearish momentum relative to the signal line.
**BARS GROWING AWAY FROM ZERO**
The distance between MACD and its signal line is increasing.
This can indicate strengthening momentum in that direction.
**BARS SHRINKING TOWARD ZERO**
The distance between MACD and its signal line is decreasing.
This can indicate weakening momentum or an approaching crossover.
### MACD ARROW LEGEND
🟢 **GREEN UP ARROW**
MACD crosses above its red signal line.
This indicates improving bullish momentum.
🔴 **RED DOWN ARROW**
MACD crosses below its red signal line.
This indicates improving bearish momentum.
Arrows appear away from the indicator lines.
They are generated after the current chart candle closes.
### HOW TO READ MACD
**MACD ABOVE SIGNAL**
Bullish momentum is favored relative to the signal line.
**MACD BELOW SIGNAL**
Bearish momentum is favored relative to the signal line.
**MACD ABOVE ZERO**
The fast 12 EMA is above the slow 26 EMA.
**MACD BELOW ZERO**
The fast 12 EMA is below the slow 26 EMA.
**MACD CROSSOVER**
Indicates a possible change in momentum.
Crossovers can occur frequently in sideways markets and are not guaranteed reversal signals.
### HOW MACD WORKS WITH YOUR MAIN ORB INDICATOR
MACD contributes only to your EARLY signals.
**EARLY CALL:**
- MACD above signal line
- RSI at least 60
- Price closes above EMA 9
**EARLY PUT:**
- MACD below signal line
- RSI 40 or lower
- Price closes below EMA 9
The main indicator's early-signal logic does not require MACD to cross on that exact candle. MACD simply needs to be on the appropriate side of its signal line.
### EXAMPLE OF EARLY BULLISH MOMENTUM
Price remains inside the completed 5-minute ORB.
MACD is above its signal line.
RSI is 63.
Price closes above EMA 9.
The main indicator may produce an EARLY CALL signal.
This means bullish momentum conditions are present, but the full ORB breakout confirmation has not occurred.
### EXAMPLE OF EARLY BEARISH MOMENTUM
Price remains inside the completed ORB.
MACD is below its signal line.
RSI is 36.
Price closes below EMA 9.
The main indicator may produce an EARLY PUT signal.
Again, this is not a confirmed trade.
### IMPORTANT REMINDERS
- MACD is not part of confirmed CALL/PUT rules.
- MACD supports early momentum signals only.
- MACD arrows are informational.
- MACD can lag price because it uses moving averages.
- MACD crossovers can be unreliable during sideways trading.
- MACD readings change with chart timeframe.
- A bullish or bearish MACD reading does not guarantee future price movement.
**BOTTOM LINE:** Use MACD to recognize early momentum and potential changes in direction. Let your main ORB indicator determine whether a CALL or PUT satisfies the four mandatory confirmation conditions.
## Complete User Guide and Symbol Legend
### PURPOSE
The Ultimate MACD Momentum Panel helps identify changes in bullish and bearish momentum.
MACD stands for Moving Average Convergence Divergence.
It compares two exponential moving averages and uses a signal line to highlight momentum changes.
Your MACD panel is separate from your main ORB chart.
**IMPORTANT: MACD IS NOT REQUIRED TO CONFIRM CALL OR PUT TRADES.**
### STANDARD SETTINGS
- Fast EMA: 12
- Slow EMA: 26
- Signal EMA: 9
- MACD line: Green
- Signal line: Red
- Histogram: Green/red
- Zero reference: White dashed
### MACD LINE LEGEND
🟢 **GREEN SOLID LINE — MACD**
Represents the difference between the fast 12 EMA and slow 26 EMA.
🔴 **RED SOLID LINE — SIGNAL**
A 9-period EMA of the MACD line.
⚪ **WHITE DASHED ZERO LINE**
A reference separating positive and negative MACD values.
When MACD is above zero, the 12 EMA is above the 26 EMA.
When MACD is below zero, the 12 EMA is below the 26 EMA.
### HISTOGRAM LEGEND
🟢 **GREEN HISTOGRAM BARS**
MACD is above its signal line.
This indicates bullish momentum relative to the signal line.
🔴 **RED HISTOGRAM BARS**
MACD is below its signal line.
This indicates bearish momentum relative to the signal line.
**BARS GROWING AWAY FROM ZERO**
The distance between MACD and its signal line is increasing.
This can indicate strengthening momentum in that direction.
**BARS SHRINKING TOWARD ZERO**
The distance between MACD and its signal line is decreasing.
This can indicate weakening momentum or an approaching crossover.
### MACD ARROW LEGEND
🟢 **GREEN UP ARROW**
MACD crosses above its red signal line.
This indicates improving bullish momentum.
🔴 **RED DOWN ARROW**
MACD crosses below its red signal line.
This indicates improving bearish momentum.
Arrows appear away from the indicator lines.
They are generated after the current chart candle closes.
### HOW TO READ MACD
**MACD ABOVE SIGNAL**
Bullish momentum is favored relative to the signal line.
**MACD BELOW SIGNAL**
Bearish momentum is favored relative to the signal line.
**MACD ABOVE ZERO**
The fast 12 EMA is above the slow 26 EMA.
**MACD BELOW ZERO**
The fast 12 EMA is below the slow 26 EMA.
**MACD CROSSOVER**
Indicates a possible change in momentum.
Crossovers can occur frequently in sideways markets and are not guaranteed reversal signals.
### HOW MACD WORKS WITH YOUR MAIN ORB INDICATOR
MACD contributes only to your EARLY signals.
**EARLY CALL:**
- MACD above signal line
- RSI at least 60
- Price closes above EMA 9
**EARLY PUT:**
- MACD below signal line
- RSI 40 or lower
- Price closes below EMA 9
The main indicator's early-signal logic does not require MACD to cross on that exact candle. MACD simply needs to be on the appropriate side of its signal line.
### EXAMPLE OF EARLY BULLISH MOMENTUM
Price remains inside the completed 5-minute ORB.
MACD is above its signal line.
RSI is 63.
Price closes above EMA 9.
The main indicator may produce an EARLY CALL signal.
This means bullish momentum conditions are present, but the full ORB breakout confirmation has not occurred.
### EXAMPLE OF EARLY BEARISH MOMENTUM
Price remains inside the completed ORB.
MACD is below its signal line.
RSI is 36.
Price closes below EMA 9.
The main indicator may produce an EARLY PUT signal.
Again, this is not a confirmed trade.
### IMPORTANT REMINDERS
- MACD is not part of confirmed CALL/PUT rules.
- MACD supports early momentum signals only.
- MACD arrows are informational.
- MACD can lag price because it uses moving averages.
- MACD crossovers can be unreliable during sideways trading.
- MACD readings change with chart timeframe.
- A bullish or bearish MACD reading does not guarantee future price movement.
**BOTTOM LINE:** Use MACD to recognize early momentum and potential changes in direction. Let your main ORB indicator determine whether a CALL or PUT satisfies the four mandatory confirmation conditions.

คำจำกัดสิทธิ์ความรับผิดชอบ
ข้อมูลและบทความไม่ได้มีวัตถุประสงค์เพื่อก่อให้เกิดกิจกรรมทางการเงิน, การลงทุน, การซื้อขาย, ข้อเสนอแนะ หรือคำแนะนำประเภทอื่น ๆ ที่ให้หรือรับรองโดย TradingView อ่านเพิ่มเติมใน ข้อกำหนดการใช้งาน
คำจำกัดสิทธิ์ความรับผิดชอบ
ข้อมูลและบทความไม่ได้มีวัตถุประสงค์เพื่อก่อให้เกิดกิจกรรมทางการเงิน, การลงทุน, การซื้อขาย, ข้อเสนอแนะ หรือคำแนะนำประเภทอื่น ๆ ที่ให้หรือรับรองโดย TradingView อ่านเพิ่มเติมใน ข้อกำหนดการใช้งาน