OPEN-SOURCE SCRIPT
ที่อัปเดต: DANI _ MTF Pullback - RSI Panel
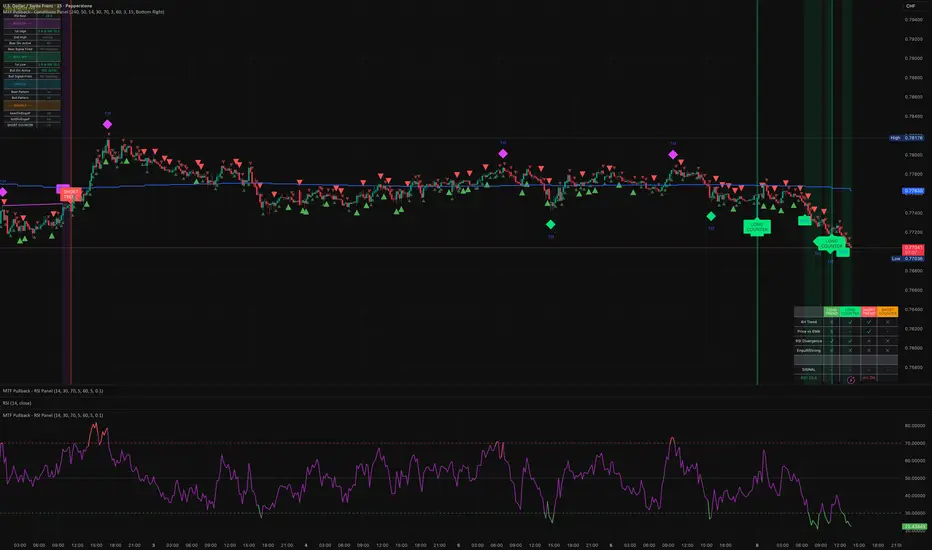
MTF Pullback - RSI Panel Summary
Purpose: Companion indicator for the main strategy that displays RSI with divergence detection in a separate pane below the price chart.
Settings
ParameterDefaultDescriptionRSI Length14Lookback period for RSI calculationRSI Oversold Level30Threshold for oversold conditionRSI Overbought Level70Threshold for overbought conditionDivergence Lookback Bars10How many bars to look back for divergence detection
What It Displays
RSI Line — Changes color based on zone:
Purple = neutral (between 30-70)
Green = oversold (below 30)
Red = overbought (above 70)
Horizontal Levels:
Red dashed line at 70 (overbought)
Green dashed line at 30 (oversold)
Gray dotted line at 50 (midpoint)
Zone Fills:
Light red shading above 70
Light green shading below 30
Divergence Markers:
"DIV" label with lime circle = bullish divergence (price makes lower low, RSI makes higher low while oversold)
"DIV" label with fuchsia circle = bearish divergence (price makes higher high, RSI makes lower high while overbought)
Background Flash:
Green flash when bullish divergence detected
Red flash when bearish divergence detected
Divergence Logic
Bullish: Price makes a lower low AND RSI makes a higher low AND RSI is in oversold territory → potential reversal up
Bearish: Price makes a higher high AND RSI makes a lower high AND RSI is in overbought territory → potential reversal down
Purpose: Companion indicator for the main strategy that displays RSI with divergence detection in a separate pane below the price chart.
Settings
ParameterDefaultDescriptionRSI Length14Lookback period for RSI calculationRSI Oversold Level30Threshold for oversold conditionRSI Overbought Level70Threshold for overbought conditionDivergence Lookback Bars10How many bars to look back for divergence detection
What It Displays
RSI Line — Changes color based on zone:
Purple = neutral (between 30-70)
Green = oversold (below 30)
Red = overbought (above 70)
Horizontal Levels:
Red dashed line at 70 (overbought)
Green dashed line at 30 (oversold)
Gray dotted line at 50 (midpoint)
Zone Fills:
Light red shading above 70
Light green shading below 30
Divergence Markers:
"DIV" label with lime circle = bullish divergence (price makes lower low, RSI makes higher low while oversold)
"DIV" label with fuchsia circle = bearish divergence (price makes higher high, RSI makes lower high while overbought)
Background Flash:
Green flash when bullish divergence detected
Red flash when bearish divergence detected
Divergence Logic
Bullish: Price makes a lower low AND RSI makes a higher low AND RSI is in oversold territory → potential reversal up
Bearish: Price makes a higher high AND RSI makes a lower high AND RSI is in overbought territory → potential reversal down
Release Note
updatesrRelease Note
updates dfสคริปต์แบบโอเพนซอร์ส
ด้วยเจตนารมณ์หลักของ TradingView ผู้สร้างสคริปต์นี้ได้ทำให้เป็นโอเพนซอร์ส เพื่อให้เทรดเดอร์สามารถตรวจสอบและยืนยันฟังก์ชันการทำงานของมันได้ ขอชื่นชมผู้เขียน! แม้ว่าคุณจะใช้งานได้ฟรี แต่โปรดจำไว้ว่าการเผยแพร่โค้ดซ้ำจะต้องเป็นไปตาม กฎระเบียบการใช้งาน ของเรา

คำจำกัดสิทธิ์ความรับผิดชอบ
ข้อมูลและบทความไม่ได้มีวัตถุประสงค์เพื่อก่อให้เกิดกิจกรรมทางการเงิน, การลงทุน, การซื้อขาย, ข้อเสนอแนะ หรือคำแนะนำประเภทอื่น ๆ ที่ให้หรือรับรองโดย TradingView อ่านเพิ่มเติมใน ข้อกำหนดการใช้งาน
สคริปต์แบบโอเพนซอร์ส
ด้วยเจตนารมณ์หลักของ TradingView ผู้สร้างสคริปต์นี้ได้ทำให้เป็นโอเพนซอร์ส เพื่อให้เทรดเดอร์สามารถตรวจสอบและยืนยันฟังก์ชันการทำงานของมันได้ ขอชื่นชมผู้เขียน! แม้ว่าคุณจะใช้งานได้ฟรี แต่โปรดจำไว้ว่าการเผยแพร่โค้ดซ้ำจะต้องเป็นไปตาม กฎระเบียบการใช้งาน ของเรา
คำจำกัดสิทธิ์ความรับผิดชอบ
ข้อมูลและบทความไม่ได้มีวัตถุประสงค์เพื่อก่อให้เกิดกิจกรรมทางการเงิน, การลงทุน, การซื้อขาย, ข้อเสนอแนะ หรือคำแนะนำประเภทอื่น ๆ ที่ให้หรือรับรองโดย TradingView อ่านเพิ่มเติมใน ข้อกำหนดการใช้งาน