Effort Weighted Profile Light
█ Overview
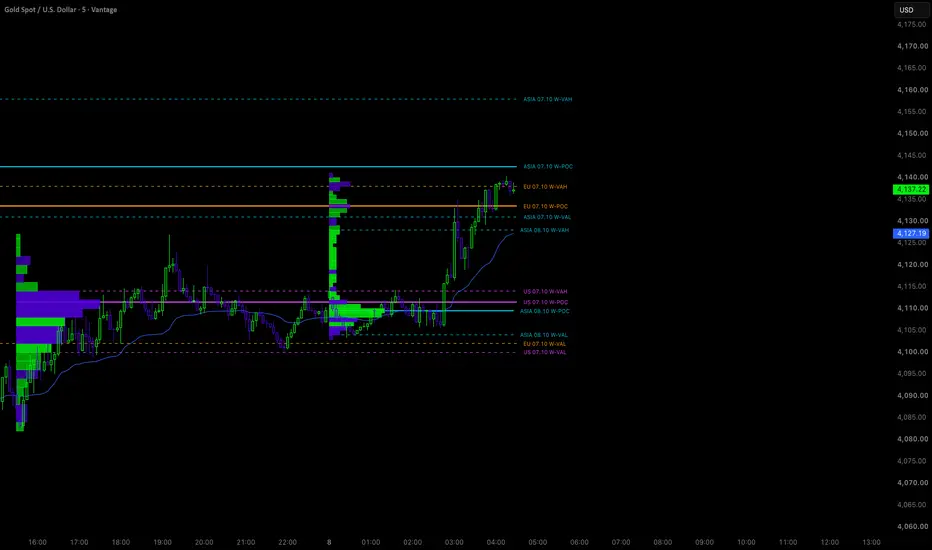
EMP Light introduces a new interpretation of the standard volume profile using ordinary lower-timeframe OHLCV data.
The indicator builds independent ASIA, EU and US session distributions. Its optional weighting model evaluates volume alongside candle-body progress and remembered visits to price zones.
Each session develops its own Point of Control and Value Area. Once collection ends, these levels become fixed and can extend forward while their underlying zones continue recording subsequent visits and estimated traded volume.
This edition does not request footprint data. It uses an analysis interval selected by the user, allowing the calculation to work with available chart and lower-timeframe data.
█ A New Interpretation of the Volume Profile
A conventional volume profile answers:
Where did the greatest amount of trading activity occur?
EMP Light's weighted interpretation explores a different question:
Where did activity concentrate after accounting for limited candle-body progress and recurring zone visits?
Each analysis candle contributes volume to the price rows intersecting its range. In W-Weighted mode, those contributions are adjusted according to candle inhibition and decaying zone memory.
A price zone can become more prominent when activity occurs with limited candle-body progress or when qualifying return visits have strengthened its remembered influence.
The resulting distribution represents weighted trading activity. Its dominant row and boundaries can differ from those of the unweighted volume distribution.
What distinguishes EMP Light
▪ Lower-timeframe reconstruction: Available analysis candles refine the estimated distribution inside larger chart bars.
▪ Effort and progress: Volume contributions are evaluated alongside each analysis candle's body relative to its range.
▪ Zone memory: Qualifying return visits strengthen remembered zones, while older encounters gradually lose influence.
▪ Session context: ASIA, EU and US develop independently and may overlap.
▪ Direct comparison: LTF Volume mode provides an unweighted reference for examining the weighting model.
▪ Independent display controls: Profile bars, level lines and labels can be configured separately.
These measurements describe observed activity. They do not establish absorption, institutional participation or a predictive trading advantage.
█ How the Volume Distribution Is Estimated
The indicator retrieves available OHLCV candles from the selected Analysis Interval.
Each analysis candle's volume is distributed across the fixed price rows intersecting its high-low range. Allocation is proportional to the price overlap between the candle and each row.
For example, a row covering one-quarter of an analysis candle's price range receives one-quarter of that candle's volume.
A candle with no price range assigns its volume to its containing row.
This approach preserves the candle's volume while estimating its distribution across prices. It assumes volume is uniformly distributed within that individual candle's range.
Smaller analysis intervals generally reduce the range over which this assumption is applied. They can refine the reconstruction, but ordinary OHLCV data cannot reveal the exact volume traded at every price.
█ Calculation Modes
LTF Volume
This mode accumulates the estimated, unweighted volume distribution.
The highest-volume row determines the POC. The Value Area contains the selected percentage of accumulated volume.
Use this mode to inspect the underlying session distribution.
W-Weighted
This mode applies candle inhibition and decaying zone memory to each allocated volume contribution.
The highest-weight row determines the W-POC. The W-Value Area contains the selected percentage of calculated weight.
The LTF edition does not use footprint delta or delta-magnitude amplification.
█ How the Weighting Engine Works
1. Volume Contribution
The starting contribution is the analysis candle's volume allocated to a price row.
2. Candle Inhibition
Inhibition measures how small the absolute analysis-candle body is relative to its full high-low range.
A smaller body relative to the range produces greater inhibition. A body occupying the entire range produces zero inhibition.
The measurement is calculated separately for each analysis candle. It describes limited body progress and does not prove that absorption occurred within a particular price row.
3. Decaying Zone Memory
Price zones can accumulate remembered strength through qualifying return visits.
A return requires an intervening analysis sample without a recorded visit. Revisit Inhibition sets the minimum inhibition required to strengthen memory.
Remembered strength decays with elapsed time, including periods between sessions. Memory Half-Life controls this decay, while Memory Cap limits the strength accumulated by an individual zone.
The core weighting expression is:
Pine Script®
Effort is the volume allocated to the row. OldMemory is the decayed remembered strength of that zone.
Memory Strength set to zero removes memory amplification while retaining candle-inhibition weighting.
Memory is updated once per analysis candle, including when sessions overlap.
█ Why POC, VAH and VAL Keep Their Names
POC, VAH and VAL describe the structural roles of levels within a distribution.
EMP Light preserves those roles while allowing the quantity being distributed to change.
POC — Point of Control
In LTF Volume mode, POC identifies the center of the row with the greatest accumulated estimated volume.
In W-Weighted mode, W-POC identifies the center of the row with the greatest accumulated EMP Light weight.
Both identify the dominant row of their respective distribution. A W-POC does not necessarily identify the row containing the greatest unweighted volume.
VAH — Value Area High
VAH marks the upper boundary of the selected coverage area.
LTF Volume mode measures coverage using estimated volume. In W-Weighted mode, W-VAH bounds an area measured using calculated weight.
VAL — Value Area Low
VAL marks the lower boundary of that same coverage area. In W-Weighted mode, it is identified as W-VAL.
The familiar names preserve a recognizable framework: a dominant row and two distribution boundaries. The W- prefix makes the weighted interpretation explicit.
█ Value Area Calculation
The Value Area expands outward from the POC, selecting neighboring rows according to their contributions until the requested coverage is reached.
With the default 70% setting:
▪ LTF Volume mode covers at least 70% of accumulated estimated volume.
▪ W-Weighted mode covers at least 70% of accumulated weight.
Complete calculation rows are included, so coverage can exceed the requested percentage.
Display-row merging changes the histogram's appearance only. POC and Value Area calculations use the underlying calculation grid.
█ Session Structure
ASIA, EU and US are independently configurable collection windows.
Sessions may overlap. An eligible analysis candle contributes once to each participating profile. Smaller analysis candles can assign different parts of a larger chart bar to different session windows.
Only analysis candles fully contained within a collection window are included.
Time Zone Preset provides regional options alongside Exchange and Custom settings. Regional IANA zones account for daylight-saving changes where applicable.
The selected zone determines how the entered session hours are interpreted. Changing it changes the actual collection windows; it does not simply change displayed dates.
EU Collection Mode
▪ Full Sessions collects until the configured EU session end.
▪ Freeze at 15:30 ends EU collection at 15:30 in the selected time zone.
The freeze is a fixed local cutoff. It does not automatically follow the US exchange opening when regional daylight-saving schedules differ.
Weekdays Only optionally restricts collection to Monday through Friday.
█ Zone Statistics and Hover Tooltips
Hover a POC, VAH or VAL label to inspect:
▪ Zone title.
▪ Touches.
▪ Unweighted estimated Volume.
Volume values use compact formatting such as 30k, 1.2m or 2b.
How touches are counted
A touch represents a separate recorded visit to the underlying calculation row.
Consecutive analysis candles with recorded activity in that row count as one continuous visit. A later visit following an intervening sample without recorded activity creates another touch. The initial visit counts.
Counts are resolved at the selected Analysis Interval. A smaller interval can distinguish visits that would appear continuous within a larger candle.
These are sampled visits inferred from candle ranges, not a tick-by-tick count of every price crossing.
Which row is measured
▪ POC uses its containing calculation row.
▪ VAH uses the uppermost row inside the Value Area.
▪ VAL uses the lowest row inside the Value Area.
During development, a level's tooltip reflects the history of its current underlying row. If the level moves, its displayed statistics can change accordingly.
After completion, an extended level retains its fixed row and continues accumulating subsequent visits and estimated volume.
Tooltip volume remains unweighted in both calculation modes and refers to the underlying price row, rather than the entire session.
█ Profile Colors
EMP Light uses the following default directional palette:
▪ Buy: #03f10d.
▪ Sell: #5100de.
▪ Neutral: #8b92a4.
Directional contributions are estimated from the analysis candles:
▪ An upward candle contributes positive directional volume.
▪ A downward candle contributes negative directional volume.
▪ For a doji, the previous close supplies the directional comparison where available.
▪ An unchanged doji without a directional comparison contributes neutrally.
Each visible histogram row is colored according to the sign of its aggregated directional contributions. In W-Weighted mode, these contributions use the profile's weighting.
The Buy and Sell names describe this directional proxy. They do not represent measured bid/ask delta or identify aggressive buyers and sellers.
Value Area Transparency and Outside VA Transparency control visibility independently. Session-level colors are configured separately.
█ Analysis Interval and Missing Data
Analysis Interval
Select an interval available on your account and symbol.
▪ A lower interval retrieves available analysis candles inside each chart bar.
▪ An equal interval uses chart OHLCV directly.
▪ A higher interval is rejected.
One minute is the default. Seconds intervals may be selected where the account and data feed support them, but they are not required.
Missing Intrabars
▪ Skip excludes chart bars with no available analysis candles.
▪ Use Chart Bar substitutes chart OHLCV only when the intrabar array is entirely empty.
The fallback provides a coarser volume estimate because distribution is reconstructed from the larger chart candle.
Partially available intrabar arrays are never topped up or rescaled to match chart volume. This avoids combining overlapping volume sources.
█ Display and Settings
Profile Engine
▪ Calculation Mode selects the estimated volume or weighted distribution.
▪ Row Size sets each calculation row's price width in minimum ticks.
▪ Maximum Rows limits calculation capacity per session.
▪ Value Area sets the required distribution coverage.
Memory Engine
▪ Memory Strength controls memory amplification.
▪ Memory Half-Life controls elapsed-time decay.
▪ Memory Cap limits remembered strength per zone.
▪ Revisit Inhibition controls which return visits strengthen memory.
Profile Display
▪ Show Profile Bars controls the histogram independently of the lines.
▪ Profile Width controls the largest visible row's width relative to the collected session duration.
▪ Display Rows controls visual detail without changing the calculated levels.
▪ Archived Profiles controls the total number of completed sessions retained across ASIA, EU and US.
Levels & Labels
▪ Show Level Lines is the master line switch.
▪ POC, VAH and VAL each have an individual switch applying to every session and its corresponding labels.
▪ Extend Completed Levels projects fixed session levels to the current chart bar.
▪ Label size, right padding, optional dates and optional prices can be configured separately.
█ Suggested Starting Configuration
1. Select a standard 5-minute or 15-minute candle chart.
2. Set Analysis Interval to 1 minute.
3. Configure the time zone and session windows for the instrument.
4. Begin with LTF Volume to inspect the estimated distribution.
5. Compare W-Weighted to examine the effect of inhibition and memory.
6. Observe developing levels during collection and fixed levels afterward.
7. Use hover statistics to study separate visits to the underlying zones.
If a profile exceeds its price-row capacity, increase Maximum Rows or Row Size.
█ Requirements and Calculation Behavior
This edition contains no footprint request and does not require TradingView footprint access. It requires OHLCV data for the selected instrument and an analysis interval supported by the user's account.
Available lower-timeframe history depends on the account, symbol and data feed. Smaller intervals consume more intrabar history and may reduce the historical chart coverage available to the calculation.
Volume units follow the instrument's feed. Some markets provide tick volume or other limited measures of activity.
Calculations update on confirmed chart bars, even when the underlying analysis interval is smaller. Developing profiles and levels may change until collection ends.
Completed levels are drawn across their session for reference. Their final values were only available when collection ended; they were not known at its beginning.
Analysis candles crossing a collection cutoff are excluded because their volume cannot be accurately divided by time.
Memory is rebuilt from available loaded data. Changing the analysis interval, available history, symbol or settings can change the distributions and touch counts.
EMP Light provides an estimated volume distribution and a defined effort-weighted interpretation. Its usefulness should be evaluated with the chosen market, data resolution and trading methodology.
EMP Light introduces a new interpretation of the standard volume profile using ordinary lower-timeframe OHLCV data.
The indicator builds independent ASIA, EU and US session distributions. Its optional weighting model evaluates volume alongside candle-body progress and remembered visits to price zones.
Each session develops its own Point of Control and Value Area. Once collection ends, these levels become fixed and can extend forward while their underlying zones continue recording subsequent visits and estimated traded volume.
This edition does not request footprint data. It uses an analysis interval selected by the user, allowing the calculation to work with available chart and lower-timeframe data.
█ A New Interpretation of the Volume Profile
A conventional volume profile answers:
Where did the greatest amount of trading activity occur?
EMP Light's weighted interpretation explores a different question:
Where did activity concentrate after accounting for limited candle-body progress and recurring zone visits?
Each analysis candle contributes volume to the price rows intersecting its range. In W-Weighted mode, those contributions are adjusted according to candle inhibition and decaying zone memory.
A price zone can become more prominent when activity occurs with limited candle-body progress or when qualifying return visits have strengthened its remembered influence.
The resulting distribution represents weighted trading activity. Its dominant row and boundaries can differ from those of the unweighted volume distribution.
What distinguishes EMP Light
▪ Lower-timeframe reconstruction: Available analysis candles refine the estimated distribution inside larger chart bars.
▪ Effort and progress: Volume contributions are evaluated alongside each analysis candle's body relative to its range.
▪ Zone memory: Qualifying return visits strengthen remembered zones, while older encounters gradually lose influence.
▪ Session context: ASIA, EU and US develop independently and may overlap.
▪ Direct comparison: LTF Volume mode provides an unweighted reference for examining the weighting model.
▪ Independent display controls: Profile bars, level lines and labels can be configured separately.
These measurements describe observed activity. They do not establish absorption, institutional participation or a predictive trading advantage.
█ How the Volume Distribution Is Estimated
The indicator retrieves available OHLCV candles from the selected Analysis Interval.
Each analysis candle's volume is distributed across the fixed price rows intersecting its high-low range. Allocation is proportional to the price overlap between the candle and each row.
For example, a row covering one-quarter of an analysis candle's price range receives one-quarter of that candle's volume.
A candle with no price range assigns its volume to its containing row.
This approach preserves the candle's volume while estimating its distribution across prices. It assumes volume is uniformly distributed within that individual candle's range.
Smaller analysis intervals generally reduce the range over which this assumption is applied. They can refine the reconstruction, but ordinary OHLCV data cannot reveal the exact volume traded at every price.
█ Calculation Modes
LTF Volume
This mode accumulates the estimated, unweighted volume distribution.
The highest-volume row determines the POC. The Value Area contains the selected percentage of accumulated volume.
Use this mode to inspect the underlying session distribution.
W-Weighted
This mode applies candle inhibition and decaying zone memory to each allocated volume contribution.
The highest-weight row determines the W-POC. The W-Value Area contains the selected percentage of calculated weight.
The LTF edition does not use footprint delta or delta-magnitude amplification.
█ How the Weighting Engine Works
1. Volume Contribution
The starting contribution is the analysis candle's volume allocated to a price row.
2. Candle Inhibition
Inhibition measures how small the absolute analysis-candle body is relative to its full high-low range.
A smaller body relative to the range produces greater inhibition. A body occupying the entire range produces zero inhibition.
The measurement is calculated separately for each analysis candle. It describes limited body progress and does not prove that absorption occurred within a particular price row.
3. Decaying Zone Memory
Price zones can accumulate remembered strength through qualifying return visits.
A return requires an intervening analysis sample without a recorded visit. Revisit Inhibition sets the minimum inhibition required to strengthen memory.
Remembered strength decays with elapsed time, including periods between sessions. Memory Half-Life controls this decay, while Memory Cap limits the strength accumulated by an individual zone.
The core weighting expression is:
Effort is the volume allocated to the row. OldMemory is the decayed remembered strength of that zone.
Memory Strength set to zero removes memory amplification while retaining candle-inhibition weighting.
Memory is updated once per analysis candle, including when sessions overlap.
█ Why POC, VAH and VAL Keep Their Names
POC, VAH and VAL describe the structural roles of levels within a distribution.
EMP Light preserves those roles while allowing the quantity being distributed to change.
POC — Point of Control
In LTF Volume mode, POC identifies the center of the row with the greatest accumulated estimated volume.
In W-Weighted mode, W-POC identifies the center of the row with the greatest accumulated EMP Light weight.
Both identify the dominant row of their respective distribution. A W-POC does not necessarily identify the row containing the greatest unweighted volume.
VAH — Value Area High
VAH marks the upper boundary of the selected coverage area.
LTF Volume mode measures coverage using estimated volume. In W-Weighted mode, W-VAH bounds an area measured using calculated weight.
VAL — Value Area Low
VAL marks the lower boundary of that same coverage area. In W-Weighted mode, it is identified as W-VAL.
The familiar names preserve a recognizable framework: a dominant row and two distribution boundaries. The W- prefix makes the weighted interpretation explicit.
█ Value Area Calculation
The Value Area expands outward from the POC, selecting neighboring rows according to their contributions until the requested coverage is reached.
With the default 70% setting:
▪ LTF Volume mode covers at least 70% of accumulated estimated volume.
▪ W-Weighted mode covers at least 70% of accumulated weight.
Complete calculation rows are included, so coverage can exceed the requested percentage.
Display-row merging changes the histogram's appearance only. POC and Value Area calculations use the underlying calculation grid.
█ Session Structure
ASIA, EU and US are independently configurable collection windows.
Sessions may overlap. An eligible analysis candle contributes once to each participating profile. Smaller analysis candles can assign different parts of a larger chart bar to different session windows.
Only analysis candles fully contained within a collection window are included.
Time Zone Preset provides regional options alongside Exchange and Custom settings. Regional IANA zones account for daylight-saving changes where applicable.
The selected zone determines how the entered session hours are interpreted. Changing it changes the actual collection windows; it does not simply change displayed dates.
EU Collection Mode
▪ Full Sessions collects until the configured EU session end.
▪ Freeze at 15:30 ends EU collection at 15:30 in the selected time zone.
The freeze is a fixed local cutoff. It does not automatically follow the US exchange opening when regional daylight-saving schedules differ.
Weekdays Only optionally restricts collection to Monday through Friday.
█ Zone Statistics and Hover Tooltips
Hover a POC, VAH or VAL label to inspect:
▪ Zone title.
▪ Touches.
▪ Unweighted estimated Volume.
Volume values use compact formatting such as 30k, 1.2m or 2b.
How touches are counted
A touch represents a separate recorded visit to the underlying calculation row.
Consecutive analysis candles with recorded activity in that row count as one continuous visit. A later visit following an intervening sample without recorded activity creates another touch. The initial visit counts.
Counts are resolved at the selected Analysis Interval. A smaller interval can distinguish visits that would appear continuous within a larger candle.
These are sampled visits inferred from candle ranges, not a tick-by-tick count of every price crossing.
Which row is measured
▪ POC uses its containing calculation row.
▪ VAH uses the uppermost row inside the Value Area.
▪ VAL uses the lowest row inside the Value Area.
During development, a level's tooltip reflects the history of its current underlying row. If the level moves, its displayed statistics can change accordingly.
After completion, an extended level retains its fixed row and continues accumulating subsequent visits and estimated volume.
Tooltip volume remains unweighted in both calculation modes and refers to the underlying price row, rather than the entire session.
█ Profile Colors
EMP Light uses the following default directional palette:
▪ Buy: #03f10d.
▪ Sell: #5100de.
▪ Neutral: #8b92a4.
Directional contributions are estimated from the analysis candles:
▪ An upward candle contributes positive directional volume.
▪ A downward candle contributes negative directional volume.
▪ For a doji, the previous close supplies the directional comparison where available.
▪ An unchanged doji without a directional comparison contributes neutrally.
Each visible histogram row is colored according to the sign of its aggregated directional contributions. In W-Weighted mode, these contributions use the profile's weighting.
The Buy and Sell names describe this directional proxy. They do not represent measured bid/ask delta or identify aggressive buyers and sellers.
Value Area Transparency and Outside VA Transparency control visibility independently. Session-level colors are configured separately.
█ Analysis Interval and Missing Data
Analysis Interval
Select an interval available on your account and symbol.
▪ A lower interval retrieves available analysis candles inside each chart bar.
▪ An equal interval uses chart OHLCV directly.
▪ A higher interval is rejected.
One minute is the default. Seconds intervals may be selected where the account and data feed support them, but they are not required.
Missing Intrabars
▪ Skip excludes chart bars with no available analysis candles.
▪ Use Chart Bar substitutes chart OHLCV only when the intrabar array is entirely empty.
The fallback provides a coarser volume estimate because distribution is reconstructed from the larger chart candle.
Partially available intrabar arrays are never topped up or rescaled to match chart volume. This avoids combining overlapping volume sources.
█ Display and Settings
Profile Engine
▪ Calculation Mode selects the estimated volume or weighted distribution.
▪ Row Size sets each calculation row's price width in minimum ticks.
▪ Maximum Rows limits calculation capacity per session.
▪ Value Area sets the required distribution coverage.
Memory Engine
▪ Memory Strength controls memory amplification.
▪ Memory Half-Life controls elapsed-time decay.
▪ Memory Cap limits remembered strength per zone.
▪ Revisit Inhibition controls which return visits strengthen memory.
Profile Display
▪ Show Profile Bars controls the histogram independently of the lines.
▪ Profile Width controls the largest visible row's width relative to the collected session duration.
▪ Display Rows controls visual detail without changing the calculated levels.
▪ Archived Profiles controls the total number of completed sessions retained across ASIA, EU and US.
Levels & Labels
▪ Show Level Lines is the master line switch.
▪ POC, VAH and VAL each have an individual switch applying to every session and its corresponding labels.
▪ Extend Completed Levels projects fixed session levels to the current chart bar.
▪ Label size, right padding, optional dates and optional prices can be configured separately.
█ Suggested Starting Configuration
1. Select a standard 5-minute or 15-minute candle chart.
2. Set Analysis Interval to 1 minute.
3. Configure the time zone and session windows for the instrument.
4. Begin with LTF Volume to inspect the estimated distribution.
5. Compare W-Weighted to examine the effect of inhibition and memory.
6. Observe developing levels during collection and fixed levels afterward.
7. Use hover statistics to study separate visits to the underlying zones.
If a profile exceeds its price-row capacity, increase Maximum Rows or Row Size.
█ Requirements and Calculation Behavior
This edition contains no footprint request and does not require TradingView footprint access. It requires OHLCV data for the selected instrument and an analysis interval supported by the user's account.
Available lower-timeframe history depends on the account, symbol and data feed. Smaller intervals consume more intrabar history and may reduce the historical chart coverage available to the calculation.
Volume units follow the instrument's feed. Some markets provide tick volume or other limited measures of activity.
Calculations update on confirmed chart bars, even when the underlying analysis interval is smaller. Developing profiles and levels may change until collection ends.
Completed levels are drawn across their session for reference. Their final values were only available when collection ended; they were not known at its beginning.
Analysis candles crossing a collection cutoff are excluded because their volume cannot be accurately divided by time.
Memory is rebuilt from available loaded data. Changing the analysis interval, available history, symbol or settings can change the distributions and touch counts.
EMP Light provides an estimated volume distribution and a defined effort-weighted interpretation. Its usefulness should be evaluated with the chosen market, data resolution and trading methodology.

คำจำกัดสิทธิ์ความรับผิดชอบ
ข้อมูลและบทความไม่ได้มีวัตถุประสงค์เพื่อก่อให้เกิดกิจกรรมทางการเงิน, การลงทุน, การซื้อขาย, ข้อเสนอแนะ หรือคำแนะนำประเภทอื่น ๆ ที่ให้หรือรับรองโดย TradingView อ่านเพิ่มเติมใน ข้อกำหนดการใช้งาน
คำจำกัดสิทธิ์ความรับผิดชอบ
ข้อมูลและบทความไม่ได้มีวัตถุประสงค์เพื่อก่อให้เกิดกิจกรรมทางการเงิน, การลงทุน, การซื้อขาย, ข้อเสนอแนะ หรือคำแนะนำประเภทอื่น ๆ ที่ให้หรือรับรองโดย TradingView อ่านเพิ่มเติมใน ข้อกำหนดการใช้งาน