OPEN-SOURCE SCRIPT
ที่อัปเดต: Previous Day and Week Ranges
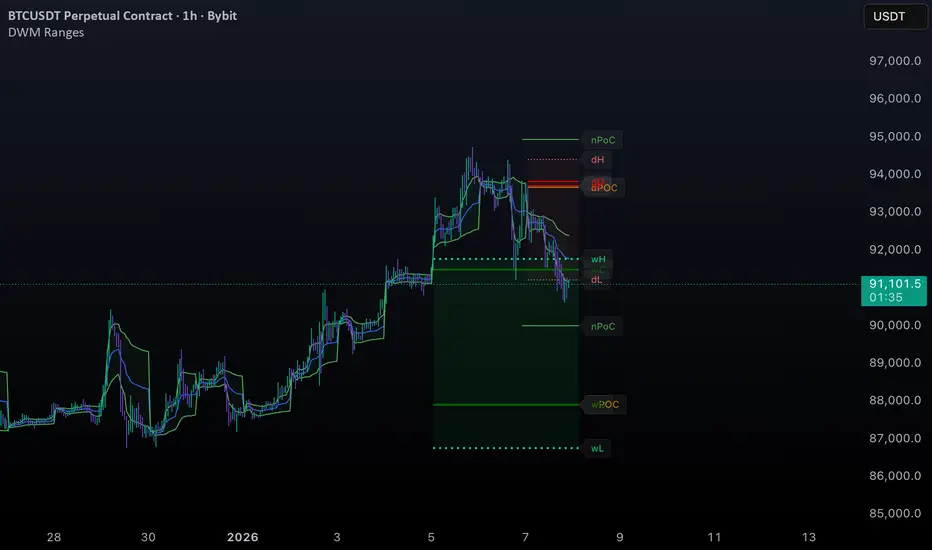
I've designed the "Previous Day and Week Ranges" indicator to enhance your trading strategy by clearly displaying daily and weekly price levels. This tool shows Open-Close and High-Low ranges for both daily and weekly timeframes directly on your trading chart.
Key Features:
This indicator is ideal for traders aiming to understand market dynamics better, offering insights into potential pivot points and zones of price stability or volatility.
Key Features:
- Potential Support and Resistance: The indicator highlights previous day and week ranges that may serve as key support or resistance levels in subsequent trading sessions.
- Customizable Display Options: Offers the flexibility to show or hide daily and weekly ranges based on your trading needs.
- Color Customization: Adjust the color settings to differentiate between upward and downward movements, enhancing visual clarity and chart readability.
This indicator is ideal for traders aiming to understand market dynamics better, offering insights into potential pivot points and zones of price stability or volatility.
Release Note
Minor bug fixRelease Note
Changelog- Significant code refactor for faster execution.
- Visualizes open-close and high-low values as labels with tooltips for the previous day and week.
- Plots lines and labels for the Point of Control (POC) of the previous day and week.
Release Note
New functions and type:- Introduced RangeColors type for improved color management.
- renderLine function for easier creation and updating of lines.
- copyAndClear method to handle data copy and clearing between BarArrays.
Release Note
nothing importantRelease Note
Added max_bars_back that sets the maximum number of bars that is available for historical reference to prevent cache issueRelease Note
Fixed issue with lines not being redrawn correctly by using persistent variables for line objects.Release Note
max_bars_back fixedRelease Note
Change log:- Updated color scheme
- Added transparency to fill color
- getPoc() function changed
Release Note
Change log:- getPoc() function uses math.floor now
Release Note
Chart updateRelease Note
Added new Method to Initializes the arrays within the `BarArrays` instance to empty arrays.
Release Note
Rolling back to the previous version, the method for BarArrays object init has been removedRelease Note
Changes to getPoc() Function:- Proportion Logic Implementation: Added detailed volume allocation logic for full, partial, and complete slot overlaps.
- Data Validation: Included checks to handle empty data sets.
- Enhanced Index Bounds Validation: Improved index bounds validation for consistent calculations.
Release Note
added Value Area High (VAH), and Value Area Low (VAL) calculation and plotsRelease Note
- Added previous Month OHLC levels
- Added a runtime error to verify timeframe validity and the presence of volume data
Release Note
Added new Custom Type for set of LinesRelease Note
Added line descriptions with the option to display Text Label, Value, or bothRelease Note
Refactored and optimized the `getPocVahVal()` function for improved computational efficiency.Release Note
Made minor adjustments and optimized the code to improve volume profile calculation speed.Release Note
Added:- label offset
- current vwap
Release Note
Added another Addon:- session volume profile PoCs (historical Pocs)
- naked / untapped Pocs
Release Note
Had to revert the nPoc rendering. It will be included in the next update after resolving the issue.Release Note
New Addon: Added Session Volume Profile (SVP) and rendering of the Nearest Naked (untapped) Point of Control.Release Note
Displays Session Volume Profiles (SVP) with the nearest naked Points of Control (PoC) above and below the current price.Release Note
Enhancements:- markVisitedPocs(): Improved logic to mark Point of Control (PoC) lines as visited. The function now iterates through PoC levels more efficiently, updating the line color and marking the PoC as not naked when it falls within the current bar’s high and low range.
- selectNakedPOCs(): Enhanced functionality to select the last two naked PoC levels, one above and one below the current close. The function now handles edge cases and ensures accurate selection of PoC levels, improving overall reliability and performance.
Release Note
Fixed an issue where the Previous Day POC was naked and resulted in two lines being plotted. Now, only a single line is displayed without overlaps.Release Note
Resolved overlapping of daily, weekly, and monthly lines.Release Note
Improved lines and labels renderingRelease Note
renderLine function optimizedRelease Note
Updated to PineScript 6.0Release Note
Supports VWAP with up to 3 configurable standard deviation bands.สคริปต์แบบโอเพนซอร์ส
ด้วยเจตนารมณ์หลักของ TradingView ผู้สร้างสคริปต์นี้ได้ทำให้เป็นโอเพนซอร์ส เพื่อให้เทรดเดอร์สามารถตรวจสอบและยืนยันฟังก์ชันการทำงานของมันได้ ขอชื่นชมผู้เขียน! แม้ว่าคุณจะใช้งานได้ฟรี แต่โปรดจำไว้ว่าการเผยแพร่โค้ดซ้ำจะต้องเป็นไปตาม กฎระเบียบการใช้งาน ของเรา

คำจำกัดสิทธิ์ความรับผิดชอบ
ข้อมูลและบทความไม่ได้มีวัตถุประสงค์เพื่อก่อให้เกิดกิจกรรมทางการเงิน, การลงทุน, การซื้อขาย, ข้อเสนอแนะ หรือคำแนะนำประเภทอื่น ๆ ที่ให้หรือรับรองโดย TradingView อ่านเพิ่มเติมใน ข้อกำหนดการใช้งาน
สคริปต์แบบโอเพนซอร์ส
ด้วยเจตนารมณ์หลักของ TradingView ผู้สร้างสคริปต์นี้ได้ทำให้เป็นโอเพนซอร์ส เพื่อให้เทรดเดอร์สามารถตรวจสอบและยืนยันฟังก์ชันการทำงานของมันได้ ขอชื่นชมผู้เขียน! แม้ว่าคุณจะใช้งานได้ฟรี แต่โปรดจำไว้ว่าการเผยแพร่โค้ดซ้ำจะต้องเป็นไปตาม กฎระเบียบการใช้งาน ของเรา
คำจำกัดสิทธิ์ความรับผิดชอบ
ข้อมูลและบทความไม่ได้มีวัตถุประสงค์เพื่อก่อให้เกิดกิจกรรมทางการเงิน, การลงทุน, การซื้อขาย, ข้อเสนอแนะ หรือคำแนะนำประเภทอื่น ๆ ที่ให้หรือรับรองโดย TradingView อ่านเพิ่มเติมใน ข้อกำหนดการใช้งาน