OPEN-SOURCE SCRIPT
ที่อัปเดต: Intraday EMA
Short Description
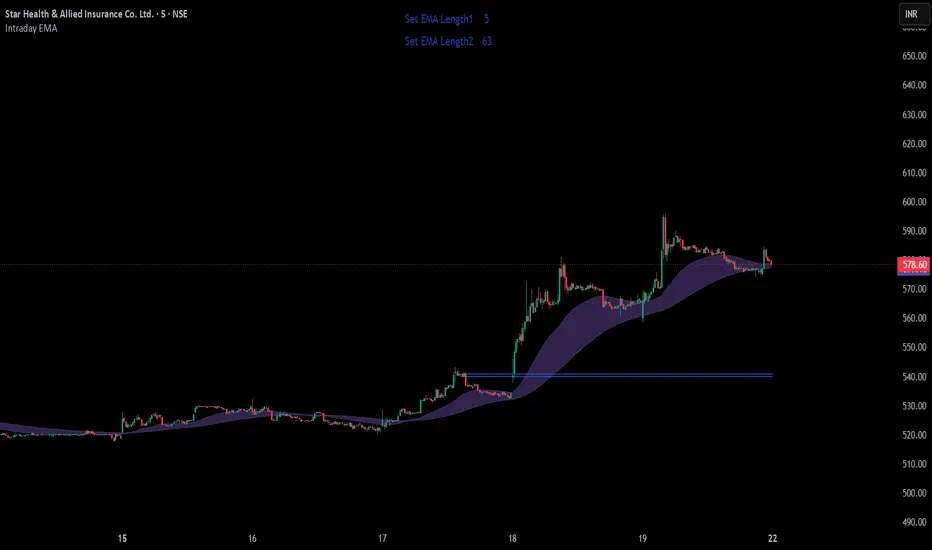
Dynamic EMA Envelope based on recent hourly high/low structure with optional single EMA mode.
Full Publishing Description
Intraday EMA Envelope
Intraday EMA Envelope is a lightweight trend-following indicator designed for intraday traders who want adaptive EMA-based structure visualization.
The script derives EMA reference lengths from recent hourly market behavior using highest and lowest price offsets over a configurable lookback period.
Features
• Adaptive EMA logic based on hourly market structure
• Optional Single EMA mode
• EMA Envelope visualization with fill zone
• Smooth EMA calculations for cleaner trend tracking
• Real-time EMA length display table
• Mutually exclusive display modes for clean chart appearance
How It Works
The indicator scans hourly candles over the selected lookback period and calculates:
Highest high offset
Lowest low offset
These offsets are converted into dynamic EMA reference lengths.
Two smoothed EMAs are then plotted:
Upper EMA
Lower EMA
Users can choose between:
Single EMA mode
EMA Envelope mode
Both modes are intentionally made mutually exclusive to avoid chart clutter.
Inputs
• Lookback Days
Controls the hourly historical range used for EMA calculations.
• Show Single EMA
Displays only one smoothed EMA.
• Show EMA Envelope
Displays the EMA channel/envelope with fill.
Best Usage
This indicator works best for:
Intraday trend identification
Pullback trading
Dynamic support/resistance tracking
Trend continuation setups
Dynamic EMA Envelope based on recent hourly high/low structure with optional single EMA mode.
Full Publishing Description
Intraday EMA Envelope
Intraday EMA Envelope is a lightweight trend-following indicator designed for intraday traders who want adaptive EMA-based structure visualization.
The script derives EMA reference lengths from recent hourly market behavior using highest and lowest price offsets over a configurable lookback period.
Features
• Adaptive EMA logic based on hourly market structure
• Optional Single EMA mode
• EMA Envelope visualization with fill zone
• Smooth EMA calculations for cleaner trend tracking
• Real-time EMA length display table
• Mutually exclusive display modes for clean chart appearance
How It Works
The indicator scans hourly candles over the selected lookback period and calculates:
Highest high offset
Lowest low offset
These offsets are converted into dynamic EMA reference lengths.
Two smoothed EMAs are then plotted:
Upper EMA
Lower EMA
Users can choose between:
Single EMA mode
EMA Envelope mode
Both modes are intentionally made mutually exclusive to avoid chart clutter.
Inputs
• Lookback Days
Controls the hourly historical range used for EMA calculations.
• Show Single EMA
Displays only one smoothed EMA.
• Show EMA Envelope
Displays the EMA channel/envelope with fill.
Best Usage
This indicator works best for:
Intraday trend identification
Pullback trading
Dynamic support/resistance tracking
Trend continuation setups
Release Note
Added :- EMA Cycle Confluence Detector [LCM Based]""Identifies synchronization points between two EMA cycle lengths using Least Common Multiple (LCM) calculations and automatically plots the latest confluence high-low zone for support and resistance analysis."
สคริปต์แบบโอเพนซอร์ส
ด้วยเจตนารมณ์หลักของ TradingView ผู้สร้างสคริปต์นี้ได้ทำให้เป็นโอเพนซอร์ส เพื่อให้เทรดเดอร์สามารถตรวจสอบและยืนยันฟังก์ชันการทำงานของมันได้ ขอชื่นชมผู้เขียน! แม้ว่าคุณจะใช้งานได้ฟรี แต่โปรดจำไว้ว่าการเผยแพร่โค้ดซ้ำจะต้องเป็นไปตาม กฎระเบียบการใช้งาน ของเรา

คำจำกัดสิทธิ์ความรับผิดชอบ
ข้อมูลและบทความไม่ได้มีวัตถุประสงค์เพื่อก่อให้เกิดกิจกรรมทางการเงิน, การลงทุน, การซื้อขาย, ข้อเสนอแนะ หรือคำแนะนำประเภทอื่น ๆ ที่ให้หรือรับรองโดย TradingView อ่านเพิ่มเติมใน ข้อกำหนดการใช้งาน
สคริปต์แบบโอเพนซอร์ส
ด้วยเจตนารมณ์หลักของ TradingView ผู้สร้างสคริปต์นี้ได้ทำให้เป็นโอเพนซอร์ส เพื่อให้เทรดเดอร์สามารถตรวจสอบและยืนยันฟังก์ชันการทำงานของมันได้ ขอชื่นชมผู้เขียน! แม้ว่าคุณจะใช้งานได้ฟรี แต่โปรดจำไว้ว่าการเผยแพร่โค้ดซ้ำจะต้องเป็นไปตาม กฎระเบียบการใช้งาน ของเรา
คำจำกัดสิทธิ์ความรับผิดชอบ
ข้อมูลและบทความไม่ได้มีวัตถุประสงค์เพื่อก่อให้เกิดกิจกรรมทางการเงิน, การลงทุน, การซื้อขาย, ข้อเสนอแนะ หรือคำแนะนำประเภทอื่น ๆ ที่ให้หรือรับรองโดย TradingView อ่านเพิ่มเติมใน ข้อกำหนดการใช้งาน