ที่อัปเดต:
Bias Dashboard (Mark)
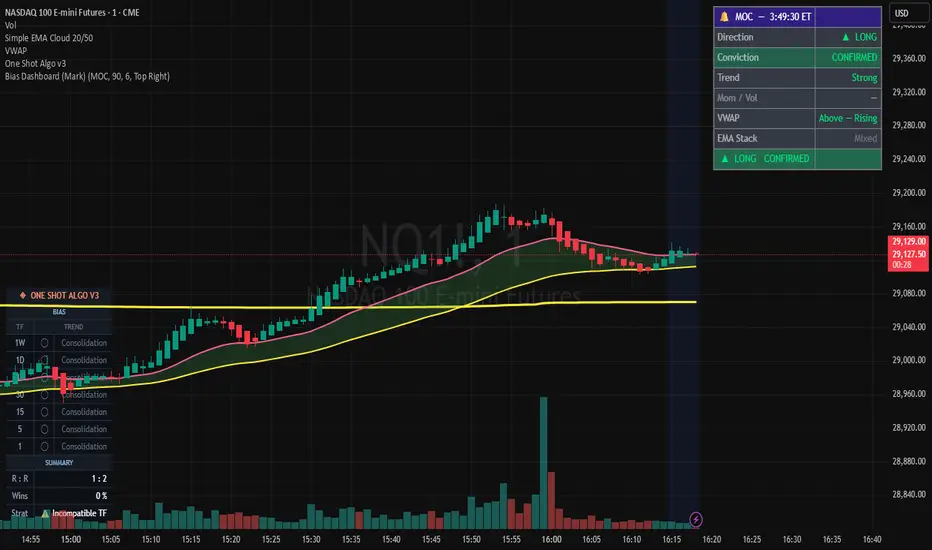
# Bias Dashboard — Documentation
### Developed for NQ Futures Trading | Version 1.0
---
## Overview
The Bias Dashboard is a TradingView Pine Script indicator designed to answer one simple question at any point during the trading day:
**Is the market breaking Long, Short, or is there no clear direction?**
It is designed for NQ futures traders but works on any instrument. It runs on the 1-minute chart and analyzes the last 90 bars of price action to determine trend direction, trend strength, momentum, volume, VWAP positioning, and EMA alignment — combining all of these into a single **Conviction** verdict.
The indicator operates in three modes and is intended to be used as a confirmation and confluence tool, not as a standalone entry signal.
---
## Modes
The indicator has three operating modes, selectable in the settings:
### ⚡ LIVE Mode
The dashboard updates in real time on every candle close. Use this mode throughout the trading day to monitor ongoing market bias. Ideal for continuously gauging whether conditions favor a long or short trade at any given moment.
### 🔔 MOC Mode (Market on Close — 3:50 PM ET)
The dashboard runs live until 3:50 PM ET, at which point it locks and freezes its readings. This gives you a snapshot of market conditions at the critical pre-close window. The snapshot holds until midnight ET, then resets automatically for the next session.
Use this mode to evaluate bias for the 3:50 PM MOC trade. The indicator looks back 90 one-minute bars from the anchor time to assess whether the trend has the strength and conviction to continue into the close.
### 🌏 ASIAN Mode (Asian Open — 8:00 PM ET)
Identical behavior to MOC mode, but anchors at 8:00 PM ET for the Asian session open. Locks at that time and resets at midnight.
Use this mode to evaluate whether the post-US-session trend has enough conviction to continue into the Asian open.
---
## What the Dashboard Shows
The dashboard displays six rows of information plus a verdict bar at the bottom.
### Direction
The overall market direction based on trend structure and momentum alignment.
- **▲ LONG** — conditions favor a long trade
- **▼ SHORT** — conditions favor a short trade
- **— FLAT** — no clear directional bias
### Conviction
How strongly all inputs agree on the stated direction. This is the most important output of the indicator. There are five levels:
- 🟢 **CONFIRMED** — All or nearly all inputs agree. High confidence trade.
- 🟡 **PROBABLE** — Most inputs agree. Good conditions, proceed normally.
- 🟠 **MARGINAL** — Mixed signals. Proceed with caution or reduce size.
- 🔴 **WEAK** — More inputs disagree than agree. Lean toward sitting out.
- ⬜ **NO TRADE** — No meaningful directional bias. Stay out.
### Trend
The strength of the prevailing trend over the last 90 one-minute bars.
- **Strong** — Price is making a clear, sustained directional move with significant slope
- **Moderate** — A trend exists but is less decisive
- **Weak** — Little or no trend structure present
This is measured using two methods simultaneously: pivot high/low structure (higher highs and higher lows for an uptrend, lower highs and lower lows for a downtrend) and a linear regression slope normalized against the Average True Range. Both must agree for a strong trend reading.
### Mom / Vol (Momentum and Volume)
Whether the current candles are showing genuine directional momentum backed by volume. Momentum and volume are treated as a single combined input because strong momentum without volume is a fake move, and strong volume without momentum is absorption — neither alone is sufficient.
- **Strong Long / Strong Short** — Large-bodied candles closing near their extremes, with volume above the 20-bar average
- **Moderate Long / Moderate Short** — Decent candle bodies with average volume
- **Weak / Mixed** — Small bodies, long wicks, or low volume — no conviction
### VWAP
Where price is relative to the Volume Weighted Average Price and which direction VWAP is sloping.
- **Above — Rising** — Price above VWAP and VWAP trending up. Institutional buying pressure. Bullish.
- **Above — Falling** — Price above VWAP but VWAP turning down. Weakening bullish condition.
- **Below — Falling** — Price below VWAP and VWAP trending down. Institutional selling pressure. Bearish.
- **Below — Rising** — Price below VWAP but VWAP turning up. Weakening bearish condition.
- **At VWAP** — Price is at the VWAP level. Decision point. Proceed with caution.
VWAP acts as a magnet — price tends to revert to it over time. This means a trade taken when price is already far from VWAP carries more mean-reversion risk than one taken when price is just breaking away from it cleanly.
### EMA Stack
The alignment of three Exponential Moving Averages — the 9, 20, and 50 EMA.
- **Bull 9>20>50** — All three EMAs in bullish order. Trend is confirmed across multiple timeframes.
- **Bear 9<20<50** — All three EMAs in bearish order. Trend is confirmed across multiple timeframes.
- **Mixed** — EMAs are not fully aligned. Short term and longer term momentum disagree.
A fully aligned EMA stack that agrees with the direction adds conviction. A stack that fights the direction reduces conviction.
### Verdict Bar
The bottom row of the dashboard combines Direction and Conviction into a single colored statement, for example:
**▲ LONG — CONFIRMED**
The background color of this bar matches the conviction level — green for confirmed/probable, orange for marginal, red for weak. This is designed to be readable at a glance without reading the individual rows above it.
---
## How Conviction is Calculated
The conviction engine works in two steps.
**Step 1 — Base Conviction Matrix**
Trend Strength and Momentum/Volume are multiplied together to produce a base conviction level:
| | Strong Trend | Moderate Trend | Weak Trend |
|---|---|---|---|
| **Strong Mom/Vol** | CONFIRMED | PROBABLE | MARGINAL |
| **Moderate Mom/Vol** | PROBABLE | MARGINAL | WEAK |
| **Weak Mom/Vol** | MARGINAL | WEAK | NO TRADE |
**Step 2 — Adjustments**
VWAP and EMA Stack each cast a vote:
- Agrees with direction = +1
- Neutral = 0
- Fights direction = -1
The two votes are combined. If both agree, conviction bumps up one level. If both fight the direction, conviction drops one level. Mixed votes leave base conviction unchanged.
This means the maximum possible conviction is CONFIRMED, and the minimum is NO TRADE, regardless of how extreme the adjustments are.
---
## How to Use It
**For MOC and Asian Open trades:**
Load the indicator in MOC or ASIAN mode. Watch the dashboard update live in the 90 minutes leading up to the event. At the anchor time it will lock. Use the frozen snapshot to decide whether conditions support a trade.
A CONFIRMED or PROBABLE verdict with a clear direction is your green light to look for an entry. MARGINAL means proceed carefully with reduced size. WEAK or NO TRADE means sit this one out.
**In LIVE mode:**
The dashboard updates continuously. Use it as a real-time bias check at any point during the session. It is particularly useful during low-volume or choppy periods when direction is unclear — a NO TRADE reading is a valid and valuable signal to stay out.
---
## Settings
| Setting | Default | Description |
|---|---|---|
| Mode | LIVE | LIVE, MOC, or ASIAN |
| Trend Lookback | 90 bars | Number of 1-minute bars for trend analysis |
| Momentum Bars | 4 bars | Number of recent candles for momentum read |
| Dashboard Position | Top Right | Top Right, Top Left, Bottom Right, Bottom Left |
| Background Color | Dark black | Dashboard background |
| Border Color | Soft white | Table border |
| Header Color | Navy | Mode header row |
| Text Color | White | Primary text |
| Label Color | Subtle white | Row label text |
---
## Important Notes
- This indicator is a **confluence tool**, not an entry signal. It tells you whether conditions are favorable. It does not tell you exactly when or where to enter. That judgment remains yours.
- On NQ futures, unexpected news events — economic data releases, policy announcements, geopolitical developments — can override any technical reading instantly. No indicator can account for surprise news.
- The indicator is designed primarily for NQ but is portable to ES, GC, CL, and other instruments without modification.
- Always trade within your risk management rules regardless of what the indicator shows. A CONFIRMED reading is not a guarantee.
---
*Bias Dashboard — Built for the trading group. Use it as one voice among several, not the only voice.*
### Developed for NQ Futures Trading | Version 1.0
---
## Overview
The Bias Dashboard is a TradingView Pine Script indicator designed to answer one simple question at any point during the trading day:
**Is the market breaking Long, Short, or is there no clear direction?**
It is designed for NQ futures traders but works on any instrument. It runs on the 1-minute chart and analyzes the last 90 bars of price action to determine trend direction, trend strength, momentum, volume, VWAP positioning, and EMA alignment — combining all of these into a single **Conviction** verdict.
The indicator operates in three modes and is intended to be used as a confirmation and confluence tool, not as a standalone entry signal.
---
## Modes
The indicator has three operating modes, selectable in the settings:
### ⚡ LIVE Mode
The dashboard updates in real time on every candle close. Use this mode throughout the trading day to monitor ongoing market bias. Ideal for continuously gauging whether conditions favor a long or short trade at any given moment.
### 🔔 MOC Mode (Market on Close — 3:50 PM ET)
The dashboard runs live until 3:50 PM ET, at which point it locks and freezes its readings. This gives you a snapshot of market conditions at the critical pre-close window. The snapshot holds until midnight ET, then resets automatically for the next session.
Use this mode to evaluate bias for the 3:50 PM MOC trade. The indicator looks back 90 one-minute bars from the anchor time to assess whether the trend has the strength and conviction to continue into the close.
### 🌏 ASIAN Mode (Asian Open — 8:00 PM ET)
Identical behavior to MOC mode, but anchors at 8:00 PM ET for the Asian session open. Locks at that time and resets at midnight.
Use this mode to evaluate whether the post-US-session trend has enough conviction to continue into the Asian open.
---
## What the Dashboard Shows
The dashboard displays six rows of information plus a verdict bar at the bottom.
### Direction
The overall market direction based on trend structure and momentum alignment.
- **▲ LONG** — conditions favor a long trade
- **▼ SHORT** — conditions favor a short trade
- **— FLAT** — no clear directional bias
### Conviction
How strongly all inputs agree on the stated direction. This is the most important output of the indicator. There are five levels:
- 🟢 **CONFIRMED** — All or nearly all inputs agree. High confidence trade.
- 🟡 **PROBABLE** — Most inputs agree. Good conditions, proceed normally.
- 🟠 **MARGINAL** — Mixed signals. Proceed with caution or reduce size.
- 🔴 **WEAK** — More inputs disagree than agree. Lean toward sitting out.
- ⬜ **NO TRADE** — No meaningful directional bias. Stay out.
### Trend
The strength of the prevailing trend over the last 90 one-minute bars.
- **Strong** — Price is making a clear, sustained directional move with significant slope
- **Moderate** — A trend exists but is less decisive
- **Weak** — Little or no trend structure present
This is measured using two methods simultaneously: pivot high/low structure (higher highs and higher lows for an uptrend, lower highs and lower lows for a downtrend) and a linear regression slope normalized against the Average True Range. Both must agree for a strong trend reading.
### Mom / Vol (Momentum and Volume)
Whether the current candles are showing genuine directional momentum backed by volume. Momentum and volume are treated as a single combined input because strong momentum without volume is a fake move, and strong volume without momentum is absorption — neither alone is sufficient.
- **Strong Long / Strong Short** — Large-bodied candles closing near their extremes, with volume above the 20-bar average
- **Moderate Long / Moderate Short** — Decent candle bodies with average volume
- **Weak / Mixed** — Small bodies, long wicks, or low volume — no conviction
### VWAP
Where price is relative to the Volume Weighted Average Price and which direction VWAP is sloping.
- **Above — Rising** — Price above VWAP and VWAP trending up. Institutional buying pressure. Bullish.
- **Above — Falling** — Price above VWAP but VWAP turning down. Weakening bullish condition.
- **Below — Falling** — Price below VWAP and VWAP trending down. Institutional selling pressure. Bearish.
- **Below — Rising** — Price below VWAP but VWAP turning up. Weakening bearish condition.
- **At VWAP** — Price is at the VWAP level. Decision point. Proceed with caution.
VWAP acts as a magnet — price tends to revert to it over time. This means a trade taken when price is already far from VWAP carries more mean-reversion risk than one taken when price is just breaking away from it cleanly.
### EMA Stack
The alignment of three Exponential Moving Averages — the 9, 20, and 50 EMA.
- **Bull 9>20>50** — All three EMAs in bullish order. Trend is confirmed across multiple timeframes.
- **Bear 9<20<50** — All three EMAs in bearish order. Trend is confirmed across multiple timeframes.
- **Mixed** — EMAs are not fully aligned. Short term and longer term momentum disagree.
A fully aligned EMA stack that agrees with the direction adds conviction. A stack that fights the direction reduces conviction.
### Verdict Bar
The bottom row of the dashboard combines Direction and Conviction into a single colored statement, for example:
**▲ LONG — CONFIRMED**
The background color of this bar matches the conviction level — green for confirmed/probable, orange for marginal, red for weak. This is designed to be readable at a glance without reading the individual rows above it.
---
## How Conviction is Calculated
The conviction engine works in two steps.
**Step 1 — Base Conviction Matrix**
Trend Strength and Momentum/Volume are multiplied together to produce a base conviction level:
| | Strong Trend | Moderate Trend | Weak Trend |
|---|---|---|---|
| **Strong Mom/Vol** | CONFIRMED | PROBABLE | MARGINAL |
| **Moderate Mom/Vol** | PROBABLE | MARGINAL | WEAK |
| **Weak Mom/Vol** | MARGINAL | WEAK | NO TRADE |
**Step 2 — Adjustments**
VWAP and EMA Stack each cast a vote:
- Agrees with direction = +1
- Neutral = 0
- Fights direction = -1
The two votes are combined. If both agree, conviction bumps up one level. If both fight the direction, conviction drops one level. Mixed votes leave base conviction unchanged.
This means the maximum possible conviction is CONFIRMED, and the minimum is NO TRADE, regardless of how extreme the adjustments are.
---
## How to Use It
**For MOC and Asian Open trades:**
Load the indicator in MOC or ASIAN mode. Watch the dashboard update live in the 90 minutes leading up to the event. At the anchor time it will lock. Use the frozen snapshot to decide whether conditions support a trade.
A CONFIRMED or PROBABLE verdict with a clear direction is your green light to look for an entry. MARGINAL means proceed carefully with reduced size. WEAK or NO TRADE means sit this one out.
**In LIVE mode:**
The dashboard updates continuously. Use it as a real-time bias check at any point during the session. It is particularly useful during low-volume or choppy periods when direction is unclear — a NO TRADE reading is a valid and valuable signal to stay out.
---
## Settings
| Setting | Default | Description |
|---|---|---|
| Mode | LIVE | LIVE, MOC, or ASIAN |
| Trend Lookback | 90 bars | Number of 1-minute bars for trend analysis |
| Momentum Bars | 4 bars | Number of recent candles for momentum read |
| Dashboard Position | Top Right | Top Right, Top Left, Bottom Right, Bottom Left |
| Background Color | Dark black | Dashboard background |
| Border Color | Soft white | Table border |
| Header Color | Navy | Mode header row |
| Text Color | White | Primary text |
| Label Color | Subtle white | Row label text |
---
## Important Notes
- This indicator is a **confluence tool**, not an entry signal. It tells you whether conditions are favorable. It does not tell you exactly when or where to enter. That judgment remains yours.
- On NQ futures, unexpected news events — economic data releases, policy announcements, geopolitical developments — can override any technical reading instantly. No indicator can account for surprise news.
- The indicator is designed primarily for NQ but is portable to ES, GC, CL, and other instruments without modification.
- Always trade within your risk management rules regardless of what the indicator shows. A CONFIRMED reading is not a guarantee.
---
*Bias Dashboard — Built for the trading group. Use it as one voice among several, not the only voice.*
Release Note
Gave more weight to Mom / Vol during MOC and the Asian Market Open.Release Note
Added a new section for the NY Open.Turned off the Mom/Vol for the MOC and Asian -- there generally is not much momentum or volume just prior to those events.
NY, MOC and Asian all lock the screen 30 seconds prior to event.
NY, MOC and Asian all reset 30 minutes after event.
Live is live all the time.

คำจำกัดสิทธิ์ความรับผิดชอบ
ข้อมูลและบทความไม่ได้มีวัตถุประสงค์เพื่อก่อให้เกิดกิจกรรมทางการเงิน, การลงทุน, การซื้อขาย, ข้อเสนอแนะ หรือคำแนะนำประเภทอื่น ๆ ที่ให้หรือรับรองโดย TradingView อ่านเพิ่มเติมใน ข้อกำหนดการใช้งาน
คำจำกัดสิทธิ์ความรับผิดชอบ
ข้อมูลและบทความไม่ได้มีวัตถุประสงค์เพื่อก่อให้เกิดกิจกรรมทางการเงิน, การลงทุน, การซื้อขาย, ข้อเสนอแนะ หรือคำแนะนำประเภทอื่น ๆ ที่ให้หรือรับรองโดย TradingView อ่านเพิ่มเติมใน ข้อกำหนดการใช้งาน