Consolidation DNA | Flux Charts
GENERAL OVERVIEW:
Consolidation DNA is a market structure tool that finds price consolidations and describes what is happening inside them. A consolidation is any stretch where price stops travelling and starts moving sideways in a contained area. Most tools stop at drawing a box around that area. Consolidation DNA draws the box and then measures twelve properties of the price action inside it. Eleven of those measurements are compared against five reference profiles, and the indicator reports which profile the consolidation matches most closely. It has two detection methods, one that builds a range out of consecutive compressed candles and one that builds a range out of a fixed price area that price has stayed inside, and both produce the same output, so a trader can choose whichever suits the instrument and the timeframe.
Once a range is confirmed, the indicator watches for the moment price leaves it. It marks that break, freezes the box at the break bar, and then follows price for a set number of bars afterwards to record how far it travelled away from the range. Those measurements are grouped by consolidation type and shown in a dashboard, so a trader can look at the loaded chart history and see how each type of consolidation behaved after it broke. The five types are Clean Coil, Choppy Range, Directional Pressure, Exhaustion, and High Effort Balance, and each one describes a different kind of sideways market. A Clean Coil and a Choppy Range both look like a box on a chart, but the price action inside them is very different, and the indicator separates them using measurements taken from the candles.

WHAT IS THE THEORY BEHIND THE INDICATOR?
Price spends a large part of every session moving sideways. Traders call these areas consolidations, ranges, bases, or coils. The common idea behind all of these names is the same. Buyers and sellers are close to balanced, so price stays inside a contained area for a while before one side takes control and price leaves the area. The problem is that not every sideways area is the same. Two boxes on a chart can look identical in width and height while the candles inside them tell completely different stories.
In one box, the candles are small, they overlap each other heavily, they close near the middle of the area, they alternate direction only occasionally, and volume is quiet. This is the classic picture of a market winding up, and traders call it a coil. In another box of the same size, the candles have long wicks on both sides, closes land near the edges, direction alternates almost every bar, and volume is higher. This is the picture of a market fighting itself, and traders call it chop. A third box holds together while the closes keep drifting toward one edge and the wicks build up on one side, so price is still contained while pressure builds in a direction. A fourth box holds while volume drops away compared with the period before it and directional progress slows down, which is a market running out of participation. A fifth box shows heavy volume, split fairly evenly between rising and falling candles, while price makes almost no net progress, so a large amount of activity is being taken inside a small area.
These five pictures are the reference profiles the indicator uses. Each one is defined by a set of numeric targets across eleven measurements. When a consolidation confirms, the indicator measures the same eleven properties on the live range and finds which of the five profiles sits closest to it in measurement space. The closeness of that match becomes a fit score, and the distance between the best match and the second best match becomes a confidence gap. Both figures describe how closely the structure resembles a profile, and neither one describes what price is likely to do next. The value of this approach is that the description comes from the price action itself. A trader reading the dashboard sees which measurements are high, which are low, and which profile they add up to, and can form a view about the range from that.
The second half of the theory is the record keeping. Once a range breaks, the indicator follows price for a fixed number of bars and records the furthest it travelled away from the range in the break direction. That travel is expressed as a multiple of the range height, so a two point move away from a two point range and a twenty point move away from a twenty point range both record as one times the range. Grouping those records by consolidation type produces a small table describing what happened after each type of consolidation broke on the loaded chart history.
CONSOLIDATION DNA FEATURES:
CONSOLIDATION DETECTION
🔹 What is Consolidation Detection?
Consolidation Detection is the part of the indicator that finds the sideways areas and draws boxes around them. It runs on every bar and produces a range that has a start bar, a high, and a low. That range moves through two states. It starts as a developing range, which means the indicator has found the beginning of something but the area has not lasted long enough to be treated as real. It then becomes a mature range once it has lasted for the required number of bars.
The classification measurements run while a range is still developing, and the dashboard may show a provisional type before confirmation. Only the classification calculated at maturity is held and used afterwards, and only mature ranges can produce a break or be added to the statistics.
🔹 Why is Consolidation Detection important?
Every other part of the indicator depends on getting the range right. If the box is drawn around the wrong bars, the measurements inside it describe the wrong price action, the classification is wrong, and the statistics are wrong. Two detection methods are offered because instruments behave differently. A fast futures contract on a low timeframe produces clean runs of small candles, which suits candle based detection. A slower instrument, or a higher timeframe, often produces a contained area made of mixed candle sizes, which suits area based detection.
🔹 How is Consolidation Detection calculated?
The Candles method looks at each candle on its own and decides whether it is a compressed candle. A candle is compressed when two conditions are both true. The body must be smaller than half of the total candle height, measured as the distance from open to close against the distance from high to low. The candle height must also be smaller than the four period Average True Range. A candle that has a small body but a large height is not compressed, and a candle that is short but almost all body is not compressed either. Both conditions must be true together.
When a compressed candle appears, a run starts. The bar it appeared on becomes the start of the range, and its high and low become the first range boundaries. Every following compressed candle extends the run, and the range high and range low widen to include that candle. While a range is still developing, the moment a candle appears that is not compressed, the run ends and is cleared completely. The range must be rebuilt from a new compressed candle.
The Visual Range method works on a fixed area. On each bar the indicator takes the highest high and the lowest low of the last three bars and treats that area as a seed range. If price then trades above the top of that area or below the bottom of it, the area is cleared and a new seed is taken from the most recent three bars. If price stays inside, the area is kept and the count of bars inside it grows. The range boundaries in this method do not widen once the seed is set, because any move outside them clears the range and starts a new one.
In both methods, the number of bars the range has lasted is measured from the start bar to the current bar. When that count reaches the required minimum, the range becomes mature. At that moment the range high and range low are frozen and they no longer move.
While a range is still developing, the indicator checks on every bar that the detection run still starts on the same bar it started on before. If the start bar changes, meaning the run was broken and a new one began, the developing range is cleared and its box is removed. Nothing is recorded for a developing range that never matured. This check stops once a range matures. A mature range holds its fixed boundaries and stays active through candles of any size until price breaks out of it.
After a mature range breaks, a new range cannot open from a detection run that began before the break bar. The indicator waits for a run that starts after the break.


🔹 Settings
🔹 Customization
CONSOLIDATION CLASSIFICATION
🔹 What is Consolidation Classification?
Consolidation Classification is the part of the indicator that describes what kind of consolidation has formed. When a range matures, the indicator measures twelve properties of the price action inside it and compares eleven of them against five reference profiles. The closest profile becomes the type of that consolidation, and the type is shown on the box color, on the label, and in the dashboard.
The five types are Clean Coil, Choppy Range, Directional Pressure, Exhaustion, and High Effort Balance. A sixth outcome, Unclear, appears when no profile is close enough.
🔹 Why is Consolidation Classification important?
A box on a chart tells a trader where a range is, and that is all. It says nothing about whether the market inside that box was winding up quietly, fighting itself, leaning in a direction, running out of participation, or absorbing heavy volume. Those are different situations and traders treat them differently. Classification gives the box a description built from the candles inside it, so the box carries information beyond its own outline.
🔹 How is Consolidation Classification calculated?
The indicator measures twelve properties on every bar. Each one is expressed as a number from zero to one hundred so they can be compared with each other.
The three Structure readings describe how contained the area is. Range Tightness compares the height of the current range against a pool of previously confirmed ranges on the same chart, so a high reading means the current range is small compared with the ranges that came before it. Candle Overlap measures how much price area each bar shares with the bar before it, averaged across the range, and a high reading means the bars sit on top of each other cleanly. Close Containment measures the share of closes that land inside the range after a padding is trimmed from the top and the bottom, and a high reading means closes are staying in the middle area.
The three Pressure readings describe whether the range is leaning in a direction. Trend Drift compares the net move from the first close in the window to the last close against the total of every close to close move in between, and a high reading means most of the movement went in one direction. Close Bias measures how far the average close sits away from the middle of the range, where a reading of zero means closes averaged out at the midpoint and a reading of one hundred means closes sat at one edge. Wick Bias measures the difference between total upper wick and total lower wick as a share of all wick, and a high reading means the wicks are concentrated on one side.
The three Chop / Effort readings describe how much back and forth action the area is taking and how busy it is. Flip Rate measures how often a candle points in the opposite direction to the one before it, and a high reading means direction alternated frequently. Wick Rejection measures the total length of all upper and lower wicks as a share of the total candle height across the range, so a high reading means a large part of the price action was wicks. Effort compares the average volume inside the range against the average volume of the window of equal length that came before it, where a reading of fifty means volume matched the earlier window and a reading above fifty means volume was higher.
The three Balance / Exhaust readings cover volume symmetry, the change in pace, and how long the setup has run. Volume Balance measures how evenly the estimated bullish and bearish volume inside the range are matched, where a high reading means the two sides are close to equal and a low reading means one side dominates, and on a symbol that reports no volume this reading is left blank and the profiles are compared on the remaining ten measurements. Slowdown compares the directional progress of the earlier window against the directional progress of the current one, and a high reading means the market made much less directional progress than it did before. Duration compares how long the current setup has lasted against the number of bars required for confirmation.
The Volume Balance reading is an estimate built from one minute candles when the chart timeframe is above one minute. Each one minute candle is counted as bullish or bearish using its body direction, falling back to its close against the previous close when the body is flat, and a candle that is flat on both counts has its volume split evenly between the two sides. That volume is then scaled by how much of the candle's price range overlaps the consolidation. This approximates how much participation happened inside the area. It is not order flow and it is not volume at price data, so it cannot show which side initiated a trade or where inside a candle the volume changed hands. When one minute data is unavailable the estimate is built from the chart candles directly. This measurement reads the most recent thirty bars of the range.

Each of the five profiles holds a target value for eleven of these measurements. The indicator measures the squared difference between every live reading and its target, averages those differences, takes the square root, and subtracts the result from one hundred. That produces a fit score for each profile. The profile with the highest fit becomes the primary type and the next highest becomes the secondary type. Two thresholds then decide what is displayed. If the highest fit is below fifty five, the type reads Unclear, because no profile was close enough to describe the range. If the highest fit is at least fifty five but the gap between the best and second best is smaller than eight, both names are displayed together separated by a slash, because two profiles describe the range almost equally well. When the fit is at least fifty five and the gap is eight or more, a single type name is displayed.
The Duration measurement is calculated and displayed in the dashboard while the five profiles hold no target for it, so it reports on the setup without affecting which type is chosen. Every other measurement in the dashboard is compared against the profiles. The type is recorded at the moment the range matures and it is held from then on. It does not change while the range waits for a break.
🔹 Reading the five types
Clean Coil sits at high Range Tightness, high Candle Overlap, high Close Containment, low Wick Rejection, low Trend Drift, and low Flip Rate. It describes a small, orderly area where the candles sit on top of each other and the closes stay in the middle.

Choppy Range sits at high Wick Rejection and high Flip Rate with weaker Close Containment. It describes a sideways area where direction changes constantly and a large part of the movement is wicks.

Directional Pressure sits at high Trend Drift and high Close Bias with a lean in Wick Bias and volume leaning to one side. It describes a range that is still holding while the closes keep pushing toward one edge. Trend Drift, Close Bias, and Wick Bias are all measured as magnitudes, so this profile reports that a lean exists while it does not name which side the lean favours. The direction is recorded separately at the moment the range breaks.

Exhaustion sits at low Effort and high Slowdown. It describes a contained area where volume has fallen away compared with the earlier window and directional progress has dropped.

High Effort Balance sits at very high Effort and very high Volume Balance while Trend Drift stays low. It describes an area taking heavy volume that is split fairly evenly between rising and falling candles while price makes almost no net progress.

🔹 Settings
🔹 Customization

RANGE BREAK DETECTION
🔹 What is Range Break Detection?
Range Break Detection is the part of the indicator that decides when a mature range has ended. Price leaving the range in either direction ends the range. The indicator records the bar it happened on, the direction it happened in, and the height of the range at that moment, then freezes the box so it stops extending to the right.
🔹 Why is Range Break Detection important?
The point at which a range ends is the point a trader cares about, because it is where the contained period stops and directional movement begins. It is also the anchor for every measurement that follows. The expansion travel is measured from the range boundary, and it is expressed as a multiple of the range height, so both numbers must be fixed at the break bar for the statistics to mean anything.
🔹 How is Range Break Detection calculated?
The indicator offers two definitions and the trader chooses one. Under Close Break the range ends when a candle closes above the range high or closes below the range low, so a candle that pushes outside the range during the bar and closes back inside does not end it. Under Wick Break the range ends the moment any part of a candle trades above the range high or below the range low, and the close is not considered at all. Close Break therefore produces fewer breaks, each one requiring a candle to settle outside the area, while Wick Break produces more and catches the first touch outside it.
The direction is recorded as up when the range high was broken and down when the range low was broken, and when both boundaries are exceeded on the same bar the upward break takes priority. At that moment the box stops extending and its right edge is fixed at the break bar, where it stays on the chart as a record of the completed range, while the live range is cleared so the indicator can begin looking for the next one.
The Close Break check reads the current close value, and the Wick Break check reads the current high and low. On a bar that has already closed these are the finalized candle values. On the bar currently forming they are live and still moving, so a break can appear and then disappear while the bar is still open, and it settles when the bar closes. An alert set to fire Once Per Bar Close will report only the breaks that survived to the candle close.


🔹 Bullish Example
A mature range holds for several bars while the dashboard release state reads Waiting. A candle then closes above the range high. With Invalidation Method set to Close Break, the range ends on that candle, the box stops extending and its right edge is fixed at that bar, and a Break Up label is placed at the range high. From that bar the indicator begins measuring how far price travels above the range high, and it continues for the number of bars set in Expansion Window.
🔹 Bearish Example
A mature range holds for several bars while the dashboard release state reads Waiting. A candle then closes below the range low. With Invalidation Method set to Close Break, the range ends on that candle, the box stops extending and its right edge is fixed at that bar, and a Break Down label is placed at the range low. From that bar the indicator begins measuring how far price travels below the range low, and it continues for the number of bars set in Expansion Window.

🔹 Settings
🔹 Customization

EXPANSION TRACKING
🔹 What is Expansion Tracking?
Expansion Tracking follows price after a range has broken and records the furthest it travelled away from the range in the break direction. It watches for a set number of bars, records the largest travel it saw, and then adds that record to a running total for the consolidation type.
🔹 Why is Expansion Tracking important?
A break on its own says only that price left the area. It says nothing about how far it went afterwards. Measuring the travel and expressing it as a multiple of the range height makes those measurements comparable across instruments, timeframes, and range sizes, which means they can be grouped and averaged. Grouping them by consolidation type produces a description of how each type behaved after breaking on the loaded chart history.
🔹 How is Expansion Tracking calculated?
When a mature range breaks, the indicator starts a record holding the break direction, the two range boundaries, and the height of the range at that moment, and from that point onward it measures on every bar how far price has travelled away from the broken boundary. For an upward break that travel is the distance from the range high up to the bar high, and for a downward break it is the distance from the range low down to the bar low, so only movement away from the range counts and a bar that trades entirely back inside contributes zero. Each measurement is divided by the range height and compared against the largest value seen so far, and whenever a new largest value appears the indicator records the bar and the price where it occurred so that exact point can be marked on the chart.
The record continues until the window set in Expansion Window has elapsed, counting the break bar itself as the first bar of that window, at which point the largest travel it saw is added to the running total for that consolidation type, the sample count for that type is added to, and the record itself is removed. Records that are still inside their window are held back and they join the averages once their window has finished. Because every measurement is expressed against the height of its own range, a travel equal to one hundred percent of the range height displays as one times, so a range that was ten points tall followed by a move of eighteen points away from the boundary records as one point eight times, which lets ranges of very different sizes be compared on one scale.
Every mature range that breaks is credited to the type profile that scored highest for it, and this includes ranges whose label read Unclear, where the fit sat below the display threshold and no type name was shown. Those breaks are still recorded and they are credited to whichever profile came closest. This is a fixed convention in the indicator, so the counts in the dashboard describe every break that occurred on the loaded chart.

🔹 Settings
🔹 Customization
CONSOLIDATION DASHBOARD
🔹 What is the Consolidation Dashboard?
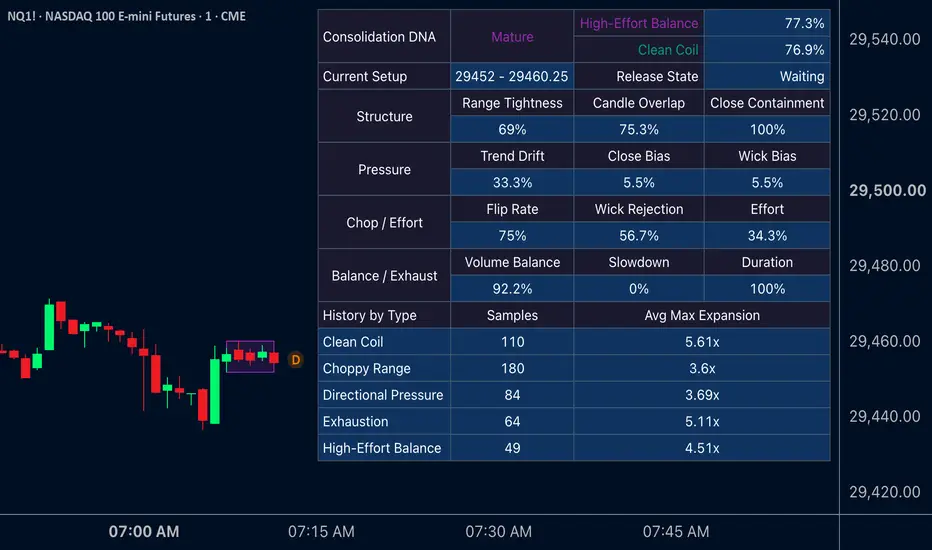
The Consolidation Dashboard is a table drawn on the chart that reports the current state of the indicator and the history it has recorded. It has three parts. The header reports what state the indicator is in and which type the active setup matches. The middle section reports twelve readings for the active setup, which are the eleven compared against the profiles plus Duration. The lower section groups the recorded breaks by type.
🔹 Why is the Consolidation Dashboard important?
The box and its color report the conclusion. The dashboard reports the measurements the conclusion was drawn from, together with Duration, which describes the setup without feeding it. A trader who can see that Range Tightness is at ninety, Candle Overlap is at eighty five, and Flip Rate is at fifteen understands why the range was described as a Clean Coil, and can also see when a reading is borderline. The type and the fit percentage are held from the moment the range matured while the measurement rows keep updating on every bar, so on a range that has been holding for a while the live readings describe the range as it stands now and the type describes it as it was at confirmation. Every cell in the table carries a tooltip explaining what it measures.
🔹 How is the Consolidation Dashboard calculated?
The header row reports the state of the indicator. It reads No active setup when nothing has been found, Developing while a range is forming, and Mature once a range has confirmed. A range is cleared on the bar it breaks, so from that bar the header returns to No active setup until the next range is found. Beside the state, the header reports the type name and the fit percentage. When a range matched two profiles closely, a second header row appears carrying the second type name and its fit percentage.
The Current Setup row appears while a setup is active. It reports the range low and the range high as a pair, and it reports the release state. The release state reads Not confirmed while the range is still developing and Waiting once it has matured and is holding.
The four measurement rows appear once the active setup has lasted at least a quarter of the bars required for confirmation, and they carry three readings each. Structure reports Range Tightness, Candle Overlap, and Close Containment, which together describe how contained the area is. Pressure reports Trend Drift, Close Bias, and Wick Bias, which together describe whether the range is leaning in a direction. Chop / Effort reports Flip Rate, Wick Rejection, and Effort, which together describe how much back and forth action the area is taking and how busy it is. Balance / Exhaust reports Volume Balance, Slowdown, and Duration. Volume Balance and Slowdown both feed the classification, and Slowdown carries its highest target of any profile in Exhaustion, while Duration describes the setup without feeding it.
The History by Type section lists all five types with two columns. Samples reports how many breaks of that type have completed the full Expansion Window. Avg Max Expansion reports the average of the furthest travel across those completed breaks, shown as a multiple of the range height. Hovering a Samples cell shows the total number of breaks detected for that type, including any that are still inside their window.
Every figure in the History section describes what occurred on the loaded chart history. Loading more history, changing the timeframe, or changing Expansion Window will change these figures.

🔹 Settings
ALERTS
🔹 What are the Alerts?
The indicator provides nine alert conditions covering confirmation and range breaks, so a trader can be told when a range confirms, what kind of range it is, and which way it eventually left.
🔹 How are the Alerts calculated?
Consolidation Confirmed fires on the bar a range matures, whatever type it was given. Five further conditions cover the individual types, named Clean Coil Confirmed, Choppy Range Confirmed, Directional Pressure Confirmed, Exhaustion Confirmed, and High Effort Balance Confirmed. Each of those fires on the same bar as the general confirmation when the range matched that type. A range carrying a combined label fires the condition for the profile that scored highest, and a range reading Unclear fires the general confirmation only.
Range Break fires on the bar a mature range is broken in either direction, and Range Break Up and Range Break Down split the same moment by side, so a trader can act on one direction alone. All three follow whichever definition is set in Invalidation Method. Developing ranges that are cleared without maturing produce no alert at all.
Conditions are created through the TradingView alert dialog by selecting the indicator and then choosing one from the condition list.
IMPORTANT NOTES:
The Volume Balance measurement is an estimate that reads one minute data through a lower timeframe request, and this happens only when the chart timeframe is above one minute, so on a one minute chart and on any chart where one minute data is unavailable for the symbol the estimate is built from the chart candles themselves, and instruments that publish no volume leave the Volume Balance row blank, in which case the measurement is left out of the profile comparison entirely so the gap cannot push the result toward any one type. The comparison pool used for Range Tightness is built from confirmed ranges on the loaded chart and it starts empty, so Range Tightness reports a neutral fifty until the first range has been confirmed and added, the reading becomes more meaningful as the pool grows toward the number set in Comparison Lookback, and loading more chart history fills the pool faster. Every figure in the History by Type section is built from the chart currently loaded, so scrolling back to load more bars, switching timeframe, switching symbol, or changing Expansion Window will rebuild these figures from scratch, while breaks that are still inside their Expansion Window are held and they join the averages once their window has finished. The type recorded for a range is fixed at the moment the range matures and it is measured from the bars available at that point, meaning a range that changes character after it confirms keeps the type it was given. Ranges that are still developing produce no records of any kind, and if a developing range is cleared before it matures its box is removed and nothing is added to the statistics. Turning Mature Boxes off removes the box drawing for mature ranges while the detection, classification, breaks, alerts, and statistics all continue to run, and with that option off no completed box is left on the chart after a break.
UNIQUENESS:
Most consolidation tools answer one question, which is where the range sits, while Consolidation DNA answers that question and then answers a second one, which is what kind of range it is. The classification is built from twelve measurements of the candles inside the range, eleven of which are compared against five reference profiles, and it is reported with a fit percentage and a confidence gap so a trader can see how strong the match is, and when two profiles describe the range almost equally well the indicator displays both names together, while a range that matches nothing closely enough is reported as Unclear. The measurement set itself covers ground that range tools normally leave out, because alongside the expected structural readings of tightness, overlap, and containment, the indicator measures how often candle direction alternates, how wick length is split between the two sides, how average close location sits against the middle of the range, how current volume compares with the window that came before it, and how much directional progress has slowed, while the bullish and bearish volume split is estimated from one minute candles and scaled by how much of each candle's price range overlaps the consolidation, so candles with less price range overlap carry less weight in the balance reading. The indicator also keeps its own record of what happened after each range ended, where travel away from the range is expressed as a multiple of the range height, which makes measurements from a two point range and a two hundred point range directly comparable, and those measurements are grouped by consolidation type to produce a small table describing how each type of consolidation behaved after breaking on the chart in front of the trader. Historical figures are built from finalized candles, while readings on the bar currently forming remain provisional until it closes. Two detection methods are offered so the tool fits different instruments and timeframes, and both feed the same classification and record keeping, while every measurement in the dashboard carries a tooltip explaining what it means and most drawing categories can be turned on or off separately, with developing and detection labels depending on their matching box setting, so the chart can be reduced to boxes alone or expanded to show labels at detection, at maturity, at the break, and at the point of furthest travel.
Consolidation DNA is a market structure tool that finds price consolidations and describes what is happening inside them. A consolidation is any stretch where price stops travelling and starts moving sideways in a contained area. Most tools stop at drawing a box around that area. Consolidation DNA draws the box and then measures twelve properties of the price action inside it. Eleven of those measurements are compared against five reference profiles, and the indicator reports which profile the consolidation matches most closely. It has two detection methods, one that builds a range out of consecutive compressed candles and one that builds a range out of a fixed price area that price has stayed inside, and both produce the same output, so a trader can choose whichever suits the instrument and the timeframe.
Once a range is confirmed, the indicator watches for the moment price leaves it. It marks that break, freezes the box at the break bar, and then follows price for a set number of bars afterwards to record how far it travelled away from the range. Those measurements are grouped by consolidation type and shown in a dashboard, so a trader can look at the loaded chart history and see how each type of consolidation behaved after it broke. The five types are Clean Coil, Choppy Range, Directional Pressure, Exhaustion, and High Effort Balance, and each one describes a different kind of sideways market. A Clean Coil and a Choppy Range both look like a box on a chart, but the price action inside them is very different, and the indicator separates them using measurements taken from the candles.
WHAT IS THE THEORY BEHIND THE INDICATOR?
Price spends a large part of every session moving sideways. Traders call these areas consolidations, ranges, bases, or coils. The common idea behind all of these names is the same. Buyers and sellers are close to balanced, so price stays inside a contained area for a while before one side takes control and price leaves the area. The problem is that not every sideways area is the same. Two boxes on a chart can look identical in width and height while the candles inside them tell completely different stories.
In one box, the candles are small, they overlap each other heavily, they close near the middle of the area, they alternate direction only occasionally, and volume is quiet. This is the classic picture of a market winding up, and traders call it a coil. In another box of the same size, the candles have long wicks on both sides, closes land near the edges, direction alternates almost every bar, and volume is higher. This is the picture of a market fighting itself, and traders call it chop. A third box holds together while the closes keep drifting toward one edge and the wicks build up on one side, so price is still contained while pressure builds in a direction. A fourth box holds while volume drops away compared with the period before it and directional progress slows down, which is a market running out of participation. A fifth box shows heavy volume, split fairly evenly between rising and falling candles, while price makes almost no net progress, so a large amount of activity is being taken inside a small area.
These five pictures are the reference profiles the indicator uses. Each one is defined by a set of numeric targets across eleven measurements. When a consolidation confirms, the indicator measures the same eleven properties on the live range and finds which of the five profiles sits closest to it in measurement space. The closeness of that match becomes a fit score, and the distance between the best match and the second best match becomes a confidence gap. Both figures describe how closely the structure resembles a profile, and neither one describes what price is likely to do next. The value of this approach is that the description comes from the price action itself. A trader reading the dashboard sees which measurements are high, which are low, and which profile they add up to, and can form a view about the range from that.
The second half of the theory is the record keeping. Once a range breaks, the indicator follows price for a fixed number of bars and records the furthest it travelled away from the range in the break direction. That travel is expressed as a multiple of the range height, so a two point move away from a two point range and a twenty point move away from a twenty point range both record as one times the range. Grouping those records by consolidation type produces a small table describing what happened after each type of consolidation broke on the loaded chart history.
CONSOLIDATION DNA FEATURES:
- Consolidation Detection
- Consolidation Classification
- Range Break Detection
- Expansion Tracking
- Consolidation Dashboard
- Alerts
CONSOLIDATION DETECTION
🔹 What is Consolidation Detection?
Consolidation Detection is the part of the indicator that finds the sideways areas and draws boxes around them. It runs on every bar and produces a range that has a start bar, a high, and a low. That range moves through two states. It starts as a developing range, which means the indicator has found the beginning of something but the area has not lasted long enough to be treated as real. It then becomes a mature range once it has lasted for the required number of bars.
The classification measurements run while a range is still developing, and the dashboard may show a provisional type before confirmation. Only the classification calculated at maturity is held and used afterwards, and only mature ranges can produce a break or be added to the statistics.
🔹 Why is Consolidation Detection important?
Every other part of the indicator depends on getting the range right. If the box is drawn around the wrong bars, the measurements inside it describe the wrong price action, the classification is wrong, and the statistics are wrong. Two detection methods are offered because instruments behave differently. A fast futures contract on a low timeframe produces clean runs of small candles, which suits candle based detection. A slower instrument, or a higher timeframe, often produces a contained area made of mixed candle sizes, which suits area based detection.
🔹 How is Consolidation Detection calculated?
The Candles method looks at each candle on its own and decides whether it is a compressed candle. A candle is compressed when two conditions are both true. The body must be smaller than half of the total candle height, measured as the distance from open to close against the distance from high to low. The candle height must also be smaller than the four period Average True Range. A candle that has a small body but a large height is not compressed, and a candle that is short but almost all body is not compressed either. Both conditions must be true together.
When a compressed candle appears, a run starts. The bar it appeared on becomes the start of the range, and its high and low become the first range boundaries. Every following compressed candle extends the run, and the range high and range low widen to include that candle. While a range is still developing, the moment a candle appears that is not compressed, the run ends and is cleared completely. The range must be rebuilt from a new compressed candle.
The Visual Range method works on a fixed area. On each bar the indicator takes the highest high and the lowest low of the last three bars and treats that area as a seed range. If price then trades above the top of that area or below the bottom of it, the area is cleared and a new seed is taken from the most recent three bars. If price stays inside, the area is kept and the count of bars inside it grows. The range boundaries in this method do not widen once the seed is set, because any move outside them clears the range and starts a new one.
In both methods, the number of bars the range has lasted is measured from the start bar to the current bar. When that count reaches the required minimum, the range becomes mature. At that moment the range high and range low are frozen and they no longer move.
While a range is still developing, the indicator checks on every bar that the detection run still starts on the same bar it started on before. If the start bar changes, meaning the run was broken and a new one began, the developing range is cleared and its box is removed. Nothing is recorded for a developing range that never matured. This check stops once a range matures. A mature range holds its fixed boundaries and stays active through candles of any size until price breaks out of it.
After a mature range breaks, a new range cannot open from a detection run that began before the break bar. The indicator waits for a run that starts after the break.
🔹 Settings
- Detection Method: Chooses how ranges are found. Candles builds the range from consecutive compressed candles. Visual Range builds the range from a fixed price area that price has stayed inside. This changes the logic of the indicator and the default is Candles.
- Min. Consolidating Candles: The number of consecutive compressed candles required before a range becomes mature. Lower numbers produce more ranges and shorter ones. Higher numbers produce fewer ranges that lasted longer. This setting is only active when Detection Method is set to Candles. The default is 4 and the range is 1 to 20.
- Min. Candles in Range: The number of bars price must stay inside the seed area before the range becomes mature. This setting is only active when Detection Method is set to Visual Range. The default is 20 and the range is 3 to 160.
🔹 Customization
- Developing Boxes: Draws the box while the range is still developing. The default is on.
- Mature Boxes: Draws the box once the range has matured, and controls whether the box is kept on the chart after the range breaks. When this is off, a mature range still produces breaks and statistics while no box is drawn for it. The default is on.
- Developing: The border and fill color used while the range is developing. The default is a light blue.
- Mature: The border and fill color used for a mature range whose type reads Unclear. Ranges with a matched type use that type color. The default is a green.
CONSOLIDATION CLASSIFICATION
🔹 What is Consolidation Classification?
Consolidation Classification is the part of the indicator that describes what kind of consolidation has formed. When a range matures, the indicator measures twelve properties of the price action inside it and compares eleven of them against five reference profiles. The closest profile becomes the type of that consolidation, and the type is shown on the box color, on the label, and in the dashboard.
The five types are Clean Coil, Choppy Range, Directional Pressure, Exhaustion, and High Effort Balance. A sixth outcome, Unclear, appears when no profile is close enough.
🔹 Why is Consolidation Classification important?
A box on a chart tells a trader where a range is, and that is all. It says nothing about whether the market inside that box was winding up quietly, fighting itself, leaning in a direction, running out of participation, or absorbing heavy volume. Those are different situations and traders treat them differently. Classification gives the box a description built from the candles inside it, so the box carries information beyond its own outline.
🔹 How is Consolidation Classification calculated?
The indicator measures twelve properties on every bar. Each one is expressed as a number from zero to one hundred so they can be compared with each other.
The three Structure readings describe how contained the area is. Range Tightness compares the height of the current range against a pool of previously confirmed ranges on the same chart, so a high reading means the current range is small compared with the ranges that came before it. Candle Overlap measures how much price area each bar shares with the bar before it, averaged across the range, and a high reading means the bars sit on top of each other cleanly. Close Containment measures the share of closes that land inside the range after a padding is trimmed from the top and the bottom, and a high reading means closes are staying in the middle area.
The three Pressure readings describe whether the range is leaning in a direction. Trend Drift compares the net move from the first close in the window to the last close against the total of every close to close move in between, and a high reading means most of the movement went in one direction. Close Bias measures how far the average close sits away from the middle of the range, where a reading of zero means closes averaged out at the midpoint and a reading of one hundred means closes sat at one edge. Wick Bias measures the difference between total upper wick and total lower wick as a share of all wick, and a high reading means the wicks are concentrated on one side.
The three Chop / Effort readings describe how much back and forth action the area is taking and how busy it is. Flip Rate measures how often a candle points in the opposite direction to the one before it, and a high reading means direction alternated frequently. Wick Rejection measures the total length of all upper and lower wicks as a share of the total candle height across the range, so a high reading means a large part of the price action was wicks. Effort compares the average volume inside the range against the average volume of the window of equal length that came before it, where a reading of fifty means volume matched the earlier window and a reading above fifty means volume was higher.
The three Balance / Exhaust readings cover volume symmetry, the change in pace, and how long the setup has run. Volume Balance measures how evenly the estimated bullish and bearish volume inside the range are matched, where a high reading means the two sides are close to equal and a low reading means one side dominates, and on a symbol that reports no volume this reading is left blank and the profiles are compared on the remaining ten measurements. Slowdown compares the directional progress of the earlier window against the directional progress of the current one, and a high reading means the market made much less directional progress than it did before. Duration compares how long the current setup has lasted against the number of bars required for confirmation.
The Volume Balance reading is an estimate built from one minute candles when the chart timeframe is above one minute. Each one minute candle is counted as bullish or bearish using its body direction, falling back to its close against the previous close when the body is flat, and a candle that is flat on both counts has its volume split evenly between the two sides. That volume is then scaled by how much of the candle's price range overlaps the consolidation. This approximates how much participation happened inside the area. It is not order flow and it is not volume at price data, so it cannot show which side initiated a trade or where inside a candle the volume changed hands. When one minute data is unavailable the estimate is built from the chart candles directly. This measurement reads the most recent thirty bars of the range.
Each of the five profiles holds a target value for eleven of these measurements. The indicator measures the squared difference between every live reading and its target, averages those differences, takes the square root, and subtracts the result from one hundred. That produces a fit score for each profile. The profile with the highest fit becomes the primary type and the next highest becomes the secondary type. Two thresholds then decide what is displayed. If the highest fit is below fifty five, the type reads Unclear, because no profile was close enough to describe the range. If the highest fit is at least fifty five but the gap between the best and second best is smaller than eight, both names are displayed together separated by a slash, because two profiles describe the range almost equally well. When the fit is at least fifty five and the gap is eight or more, a single type name is displayed.
The Duration measurement is calculated and displayed in the dashboard while the five profiles hold no target for it, so it reports on the setup without affecting which type is chosen. Every other measurement in the dashboard is compared against the profiles. The type is recorded at the moment the range matures and it is held from then on. It does not change while the range waits for a break.
🔹 Reading the five types
Clean Coil sits at high Range Tightness, high Candle Overlap, high Close Containment, low Wick Rejection, low Trend Drift, and low Flip Rate. It describes a small, orderly area where the candles sit on top of each other and the closes stay in the middle.
Choppy Range sits at high Wick Rejection and high Flip Rate with weaker Close Containment. It describes a sideways area where direction changes constantly and a large part of the movement is wicks.
Directional Pressure sits at high Trend Drift and high Close Bias with a lean in Wick Bias and volume leaning to one side. It describes a range that is still holding while the closes keep pushing toward one edge. Trend Drift, Close Bias, and Wick Bias are all measured as magnitudes, so this profile reports that a lean exists while it does not name which side the lean favours. The direction is recorded separately at the moment the range breaks.
Exhaustion sits at low Effort and high Slowdown. It describes a contained area where volume has fallen away compared with the earlier window and directional progress has dropped.
High Effort Balance sits at very high Effort and very high Volume Balance while Trend Drift stays low. It describes an area taking heavy volume that is split fairly evenly between rising and falling candles while price makes almost no net progress.
🔹 Settings
- Comparison Lookback: The number of previously confirmed ranges kept as the comparison pool for Range Tightness. A larger number compares the current range against a longer history and a smaller number compares it against recent conditions only. The pool fills up as ranges confirm on the loaded chart, so Range Tightness reads a neutral fifty until the first range has been recorded. The default is 200 and the range is 40 to 1000.
- Analysis Window: The largest number of bars used to measure the price action inside a range. A range longer than this number is measured using its most recent bars up to this limit. The default is 200 and the range is 10 to 1000.
- Inner Close Padding %: The share of the range height trimmed from the top and the bottom before Close Containment counts which closes are inside. A larger number demands that closes sit closer to the middle before they count as contained. A value of zero counts every close inside the range. The default is 10 and the range is 0 to 40.
🔹 Customization
- Clean Coil: The color used for boxes, labels, and dashboard text when the type is Clean Coil. The default is teal.
- Choppy Range: The color used when the type is Choppy Range. The default is orange.
- Directional Pressure: The color used when the type is Directional Pressure. The default is blue.
- Exhaustion: The color used when the type is Exhaustion. The default is amber.
- High Effort Balance: The color used when the type is High Effort Balance. The default is purple.
- Detection Labels: Draws a label above the box on the bar a range matures, showing the type name and the fit percentage. The label carries a tooltip describing the type and listing the fit and the confidence gap. This option requires Mature Boxes to be on. The default is off.
- Developing Labels: Draws a label at the midpoint of the box on the bar a developing range starts. This option requires Developing Boxes to be on. The default is off.
RANGE BREAK DETECTION
🔹 What is Range Break Detection?
Range Break Detection is the part of the indicator that decides when a mature range has ended. Price leaving the range in either direction ends the range. The indicator records the bar it happened on, the direction it happened in, and the height of the range at that moment, then freezes the box so it stops extending to the right.
🔹 Why is Range Break Detection important?
The point at which a range ends is the point a trader cares about, because it is where the contained period stops and directional movement begins. It is also the anchor for every measurement that follows. The expansion travel is measured from the range boundary, and it is expressed as a multiple of the range height, so both numbers must be fixed at the break bar for the statistics to mean anything.
🔹 How is Range Break Detection calculated?
The indicator offers two definitions and the trader chooses one. Under Close Break the range ends when a candle closes above the range high or closes below the range low, so a candle that pushes outside the range during the bar and closes back inside does not end it. Under Wick Break the range ends the moment any part of a candle trades above the range high or below the range low, and the close is not considered at all. Close Break therefore produces fewer breaks, each one requiring a candle to settle outside the area, while Wick Break produces more and catches the first touch outside it.
The direction is recorded as up when the range high was broken and down when the range low was broken, and when both boundaries are exceeded on the same bar the upward break takes priority. At that moment the box stops extending and its right edge is fixed at the break bar, where it stays on the chart as a record of the completed range, while the live range is cleared so the indicator can begin looking for the next one.
The Close Break check reads the current close value, and the Wick Break check reads the current high and low. On a bar that has already closed these are the finalized candle values. On the bar currently forming they are live and still moving, so a break can appear and then disappear while the bar is still open, and it settles when the bar closes. An alert set to fire Once Per Bar Close will report only the breaks that survived to the candle close.
🔹 Bullish Example
A mature range holds for several bars while the dashboard release state reads Waiting. A candle then closes above the range high. With Invalidation Method set to Close Break, the range ends on that candle, the box stops extending and its right edge is fixed at that bar, and a Break Up label is placed at the range high. From that bar the indicator begins measuring how far price travels above the range high, and it continues for the number of bars set in Expansion Window.
🔹 Bearish Example
A mature range holds for several bars while the dashboard release state reads Waiting. A candle then closes below the range low. With Invalidation Method set to Close Break, the range ends on that candle, the box stops extending and its right edge is fixed at that bar, and a Break Down label is placed at the range low. From that bar the indicator begins measuring how far price travels below the range low, and it continues for the number of bars set in Expansion Window.
🔹 Settings
- Invalidation Method: Chooses the definition used to end a mature range. Wick Break ends the range on any trade outside the boundaries. Close Break requires a candle to close outside the boundaries. The default is Close Break.
🔹 Customization
- Release Labels: Draws a label at the broken boundary on the break bar, reading Break Up or Break Down. The label carries a tooltip listing the method used, the type of the range, the fit percentage, and the range height. The default is off.
- Max Stored Boxes: The largest number of completed boxes kept on the chart. Once the count passes this number, the oldest completed box is removed. The default is 80 and the range is 10 to 180.
- Max Stored Labels: The largest number of labels kept on the chart across all label types. Once the count passes this number, the oldest label is removed. The default is 120 and the range is 10 to 400.
EXPANSION TRACKING
🔹 What is Expansion Tracking?
Expansion Tracking follows price after a range has broken and records the furthest it travelled away from the range in the break direction. It watches for a set number of bars, records the largest travel it saw, and then adds that record to a running total for the consolidation type.
🔹 Why is Expansion Tracking important?
A break on its own says only that price left the area. It says nothing about how far it went afterwards. Measuring the travel and expressing it as a multiple of the range height makes those measurements comparable across instruments, timeframes, and range sizes, which means they can be grouped and averaged. Grouping them by consolidation type produces a description of how each type behaved after breaking on the loaded chart history.
🔹 How is Expansion Tracking calculated?
When a mature range breaks, the indicator starts a record holding the break direction, the two range boundaries, and the height of the range at that moment, and from that point onward it measures on every bar how far price has travelled away from the broken boundary. For an upward break that travel is the distance from the range high up to the bar high, and for a downward break it is the distance from the range low down to the bar low, so only movement away from the range counts and a bar that trades entirely back inside contributes zero. Each measurement is divided by the range height and compared against the largest value seen so far, and whenever a new largest value appears the indicator records the bar and the price where it occurred so that exact point can be marked on the chart.
The record continues until the window set in Expansion Window has elapsed, counting the break bar itself as the first bar of that window, at which point the largest travel it saw is added to the running total for that consolidation type, the sample count for that type is added to, and the record itself is removed. Records that are still inside their window are held back and they join the averages once their window has finished. Because every measurement is expressed against the height of its own range, a travel equal to one hundred percent of the range height displays as one times, so a range that was ten points tall followed by a move of eighteen points away from the boundary records as one point eight times, which lets ranges of very different sizes be compared on one scale.
Every mature range that breaks is credited to the type profile that scored highest for it, and this includes ranges whose label read Unclear, where the fit sat below the display threshold and no type name was shown. Those breaks are still recorded and they are credited to whichever profile came closest. This is a fixed convention in the indicator, so the counts in the dashboard describe every break that occurred on the loaded chart.
🔹 Settings
- Expansion Window: The length of the measurement window, counted from the break bar. The break bar itself counts as the first bar, so a value of 50 covers the break bar and the 49 bars that follow it. A short window records the immediate reaction to the break. A long window records how far the move eventually reached. Changing this number changes every average in the dashboard, because it changes how long each break is followed. The default is 50 and the range is 1 to 500.
🔹 Customization
- Expansion Labels: Draws a label showing the travel as a multiple of the range height. It is placed once the window has finished, on the earlier bar where the furthest travel occurred, so it marks a completed outcome in hindsight and it is not present while that move is happening. The default is off.
CONSOLIDATION DASHBOARD
🔹 What is the Consolidation Dashboard?
The Consolidation Dashboard is a table drawn on the chart that reports the current state of the indicator and the history it has recorded. It has three parts. The header reports what state the indicator is in and which type the active setup matches. The middle section reports twelve readings for the active setup, which are the eleven compared against the profiles plus Duration. The lower section groups the recorded breaks by type.
🔹 Why is the Consolidation Dashboard important?
The box and its color report the conclusion. The dashboard reports the measurements the conclusion was drawn from, together with Duration, which describes the setup without feeding it. A trader who can see that Range Tightness is at ninety, Candle Overlap is at eighty five, and Flip Rate is at fifteen understands why the range was described as a Clean Coil, and can also see when a reading is borderline. The type and the fit percentage are held from the moment the range matured while the measurement rows keep updating on every bar, so on a range that has been holding for a while the live readings describe the range as it stands now and the type describes it as it was at confirmation. Every cell in the table carries a tooltip explaining what it measures.
🔹 How is the Consolidation Dashboard calculated?
The header row reports the state of the indicator. It reads No active setup when nothing has been found, Developing while a range is forming, and Mature once a range has confirmed. A range is cleared on the bar it breaks, so from that bar the header returns to No active setup until the next range is found. Beside the state, the header reports the type name and the fit percentage. When a range matched two profiles closely, a second header row appears carrying the second type name and its fit percentage.
The Current Setup row appears while a setup is active. It reports the range low and the range high as a pair, and it reports the release state. The release state reads Not confirmed while the range is still developing and Waiting once it has matured and is holding.
The four measurement rows appear once the active setup has lasted at least a quarter of the bars required for confirmation, and they carry three readings each. Structure reports Range Tightness, Candle Overlap, and Close Containment, which together describe how contained the area is. Pressure reports Trend Drift, Close Bias, and Wick Bias, which together describe whether the range is leaning in a direction. Chop / Effort reports Flip Rate, Wick Rejection, and Effort, which together describe how much back and forth action the area is taking and how busy it is. Balance / Exhaust reports Volume Balance, Slowdown, and Duration. Volume Balance and Slowdown both feed the classification, and Slowdown carries its highest target of any profile in Exhaustion, while Duration describes the setup without feeding it.
The History by Type section lists all five types with two columns. Samples reports how many breaks of that type have completed the full Expansion Window. Avg Max Expansion reports the average of the furthest travel across those completed breaks, shown as a multiple of the range height. Hovering a Samples cell shows the total number of breaks detected for that type, including any that are still inside their window.
Every figure in the History section describes what occurred on the loaded chart history. Loading more history, changing the timeframe, or changing Expansion Window will change these figures.
🔹 Settings
- Show Dashboard: Draws the dashboard table on the chart. The default is on.
- Position: Places the dashboard at one of nine points on the chart. The options are Top Right, Top Center, Top Left, Middle Right, Middle Center, Middle Left, Bottom Right, Bottom Center, and Bottom Left. The default is Top Right. This dropdown sits beside Show Dashboard and carries no label of its own.
- Size: Sets the text size of the dashboard. The options are Tiny, Small, Normal, Large, and Huge. The default is Normal. This dropdown sits beside the position dropdown and carries no label of its own.
ALERTS
🔹 What are the Alerts?
The indicator provides nine alert conditions covering confirmation and range breaks, so a trader can be told when a range confirms, what kind of range it is, and which way it eventually left.
🔹 How are the Alerts calculated?
Consolidation Confirmed fires on the bar a range matures, whatever type it was given. Five further conditions cover the individual types, named Clean Coil Confirmed, Choppy Range Confirmed, Directional Pressure Confirmed, Exhaustion Confirmed, and High Effort Balance Confirmed. Each of those fires on the same bar as the general confirmation when the range matched that type. A range carrying a combined label fires the condition for the profile that scored highest, and a range reading Unclear fires the general confirmation only.
Range Break fires on the bar a mature range is broken in either direction, and Range Break Up and Range Break Down split the same moment by side, so a trader can act on one direction alone. All three follow whichever definition is set in Invalidation Method. Developing ranges that are cleared without maturing produce no alert at all.
Conditions are created through the TradingView alert dialog by selecting the indicator and then choosing one from the condition list.
IMPORTANT NOTES:
The Volume Balance measurement is an estimate that reads one minute data through a lower timeframe request, and this happens only when the chart timeframe is above one minute, so on a one minute chart and on any chart where one minute data is unavailable for the symbol the estimate is built from the chart candles themselves, and instruments that publish no volume leave the Volume Balance row blank, in which case the measurement is left out of the profile comparison entirely so the gap cannot push the result toward any one type. The comparison pool used for Range Tightness is built from confirmed ranges on the loaded chart and it starts empty, so Range Tightness reports a neutral fifty until the first range has been confirmed and added, the reading becomes more meaningful as the pool grows toward the number set in Comparison Lookback, and loading more chart history fills the pool faster. Every figure in the History by Type section is built from the chart currently loaded, so scrolling back to load more bars, switching timeframe, switching symbol, or changing Expansion Window will rebuild these figures from scratch, while breaks that are still inside their Expansion Window are held and they join the averages once their window has finished. The type recorded for a range is fixed at the moment the range matures and it is measured from the bars available at that point, meaning a range that changes character after it confirms keeps the type it was given. Ranges that are still developing produce no records of any kind, and if a developing range is cleared before it matures its box is removed and nothing is added to the statistics. Turning Mature Boxes off removes the box drawing for mature ranges while the detection, classification, breaks, alerts, and statistics all continue to run, and with that option off no completed box is left on the chart after a break.
UNIQUENESS:
Most consolidation tools answer one question, which is where the range sits, while Consolidation DNA answers that question and then answers a second one, which is what kind of range it is. The classification is built from twelve measurements of the candles inside the range, eleven of which are compared against five reference profiles, and it is reported with a fit percentage and a confidence gap so a trader can see how strong the match is, and when two profiles describe the range almost equally well the indicator displays both names together, while a range that matches nothing closely enough is reported as Unclear. The measurement set itself covers ground that range tools normally leave out, because alongside the expected structural readings of tightness, overlap, and containment, the indicator measures how often candle direction alternates, how wick length is split between the two sides, how average close location sits against the middle of the range, how current volume compares with the window that came before it, and how much directional progress has slowed, while the bullish and bearish volume split is estimated from one minute candles and scaled by how much of each candle's price range overlaps the consolidation, so candles with less price range overlap carry less weight in the balance reading. The indicator also keeps its own record of what happened after each range ended, where travel away from the range is expressed as a multiple of the range height, which makes measurements from a two point range and a two hundred point range directly comparable, and those measurements are grouped by consolidation type to produce a small table describing how each type of consolidation behaved after breaking on the chart in front of the trader. Historical figures are built from finalized candles, while readings on the bar currently forming remain provisional until it closes. Two detection methods are offered so the tool fits different instruments and timeframes, and both feed the same classification and record keeping, while every measurement in the dashboard carries a tooltip explaining what it means and most drawing categories can be turned on or off separately, with developing and detection labels depending on their matching box setting, so the chart can be reduced to boxes alone or expanded to show labels at detection, at maturity, at the break, and at the point of furthest travel.

Access Flux Charts' exclusive indicators: fluxcharts.com/
Join our Discord community: discord.gg/FluxCharts
Join our Discord community: discord.gg/FluxCharts
คำจำกัดสิทธิ์ความรับผิดชอบ
ข้อมูลและบทความไม่ได้มีวัตถุประสงค์เพื่อก่อให้เกิดกิจกรรมทางการเงิน, การลงทุน, การซื้อขาย, ข้อเสนอแนะ หรือคำแนะนำประเภทอื่น ๆ ที่ให้หรือรับรองโดย TradingView อ่านเพิ่มเติมใน ข้อกำหนดการใช้งาน
Access Flux Charts' exclusive indicators: fluxcharts.com/
Join our Discord community: discord.gg/FluxCharts
Join our Discord community: discord.gg/FluxCharts
คำจำกัดสิทธิ์ความรับผิดชอบ
ข้อมูลและบทความไม่ได้มีวัตถุประสงค์เพื่อก่อให้เกิดกิจกรรมทางการเงิน, การลงทุน, การซื้อขาย, ข้อเสนอแนะ หรือคำแนะนำประเภทอื่น ๆ ที่ให้หรือรับรองโดย TradingView อ่านเพิ่มเติมใน ข้อกำหนดการใช้งาน