[ad] HTF
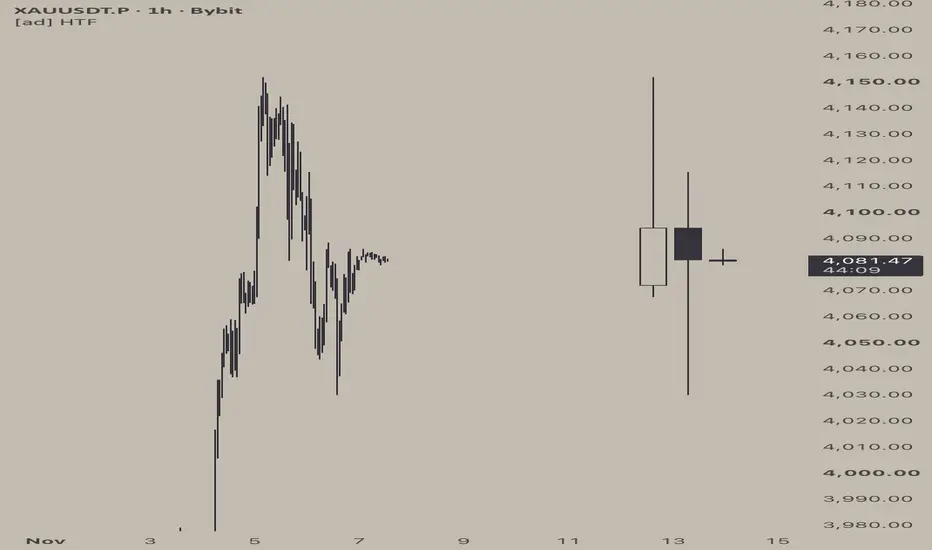
[ad] HTF displays the latest higher-timeframe candles to the right of your chart on the same price scale. It lets you compare the current intraday move with the higher-timeframe candle bodies and wicks without switching intervals.
Choose H4, Daily, 3 Days, Weekly, or Monthly in the indicator settings. The default is three Daily candles. You can display 2 to 10 candles, including the current one. The oldest candle is on the left; the rightmost candle updates as new data arrives. Closed candles use the symbol's native OHLC data for the selected timeframe.
The indicator works on standard minute-based charts from 1 minute through 4 hours when the selected candle timeframe is strictly higher than the chart timeframe. Adjust the offset, candle width, and colors in the settings. The XAUUSDT.P 1-hour example uses custom colors and spacing. If the candles are clipped, drag the chart left to make room or reduce the offset or width.
If the current higher-timeframe candle is unavailable from the feed, the indicator temporarily builds it from available chart bars. It may differ from the native candle when chart history is limited or a bar crosses a timeframe boundary.
For chart context only. No signals, alerts, or financial advice.
Choose H4, Daily, 3 Days, Weekly, or Monthly in the indicator settings. The default is three Daily candles. You can display 2 to 10 candles, including the current one. The oldest candle is on the left; the rightmost candle updates as new data arrives. Closed candles use the symbol's native OHLC data for the selected timeframe.
The indicator works on standard minute-based charts from 1 minute through 4 hours when the selected candle timeframe is strictly higher than the chart timeframe. Adjust the offset, candle width, and colors in the settings. The XAUUSDT.P 1-hour example uses custom colors and spacing. If the candles are clipped, drag the chart left to make room or reduce the offset or width.
If the current higher-timeframe candle is unavailable from the feed, the indicator temporarily builds it from available chart bars. It may differ from the native candle when chart history is limited or a bar crosses a timeframe boundary.
For chart context only. No signals, alerts, or financial advice.

คำจำกัดสิทธิ์ความรับผิดชอบ
ข้อมูลและบทความไม่ได้มีวัตถุประสงค์เพื่อก่อให้เกิดกิจกรรมทางการเงิน, การลงทุน, การซื้อขาย, ข้อเสนอแนะ หรือคำแนะนำประเภทอื่น ๆ ที่ให้หรือรับรองโดย TradingView อ่านเพิ่มเติมใน ข้อกำหนดการใช้งาน
คำจำกัดสิทธิ์ความรับผิดชอบ
ข้อมูลและบทความไม่ได้มีวัตถุประสงค์เพื่อก่อให้เกิดกิจกรรมทางการเงิน, การลงทุน, การซื้อขาย, ข้อเสนอแนะ หรือคำแนะนำประเภทอื่น ๆ ที่ให้หรือรับรองโดย TradingView อ่านเพิ่มเติมใน ข้อกำหนดการใช้งาน