Eye Liquidity Heatmap [EyeAlgo]
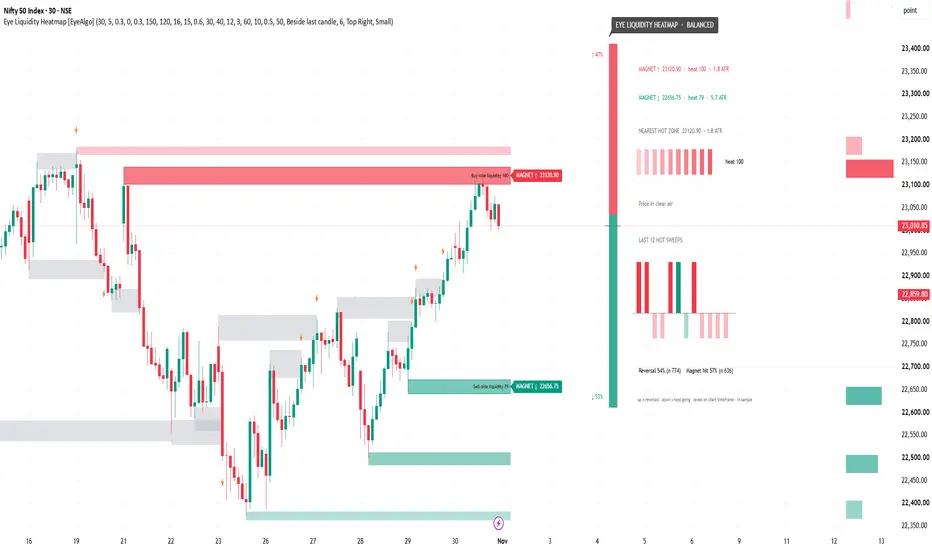
Stop orders often rest just beyond swing highs and swing lows. Eye Liquidity Heatmap estimates where those resting orders are most likely to cluster, scores each pool from cold to hot, removes a pool once price sweeps it, and counts on your own chart how often a hot sweep reversed and how often the hottest pool (the magnet) was reached.

◆ OVERVIEW
Liquidity tools usually draw a line or a box at every swing and leave you to guess which one matters. This script gives each pool a heat score from 0 to 100, so the chart answers three questions at a glance:
▶ Where is the biggest pool of liquidity above price, and below price?
▶ Is price sitting inside a hot pool right now, or in clear air?
▶ On this symbol, when a hot pool was swept, how often did price turn back?
◆ HOW TO READ THE CHART
▶ Red bands = buy-side liquidity above price (buy stops are expected above swing highs). Green bands = sell-side liquidity below price (sell stops below swing lows).
▶ Colour strength = heat. A light, thin band is a cold pool; a strong, thick band is a hot pool. Bands with heat 70 or more also get an outline and a name, for example "Buy-side liquidity 86 · ×3 · round" (×3 = three swings stacked at the same price, round = near a round number).
▶ "Hot" everywhere else (⚡ marks, candle colour, nearest hot zone, stats and alerts) means heat at or above the "Hot zone = heat ≥" setting (60).
▶ A grey band that stops at a candle = a pool that was swept (price traded through it). A ⚡ above or below that candle marks the sweep of a hot pool.
▶ MAGNET ↑ / MAGNET ↓ labels next to the candles = the hottest pool above and below price within "Show levels within" (16 ATR). If one side has no pool within that distance, the hottest pool beyond it is used, marked "far" and drawn at the edge of that distance so the chart scale stays clean.
▶ Candles take the pool's colour (red above, green below) while the close is inside a hot band.
▶ The bars on the right (after the dashboard in "Beside last candle" mode, after the bands otherwise) are the heat profile: total heat at each price row, red above price and green below.
◆ HOW THE HEAT IS BUILT
1. Pools: every confirmed swing high and swing low ("Swing length", 5 bars each side) on the build timeframe becomes a pool.
2. Stacking: a new swing within "Equal highs/lows tolerance (× ATR)" (0.3) of an existing pool on the same side joins it: its weight is added to the pool's current heat with a 50% bonus. Equal highs and equal lows therefore get hotter than single swings.
3. Weight: a swing with more volume than its 50-bar average weighs more (between 0.5x and 3x). A new pool within the same tolerance of a round number gets 1.3x (step chosen from the price size, about 25 on gold or 250 on Nifty, or set "Round number step"). Each bar of the build timeframe that touches the pool without breaking it adds "Heat added per touch without break" (0.3).
4. Decay: a pool loses half of its heat every "Heat half-life" bars of the build timeframe (150) since it was last stacked or touched, so pools that price ignores fade.
5. Heat 0-100: the weight is shown relative to the hottest active pool on a square-root scale, so one giant pool does not make every other pool look cold.
6. Sweep: when a candle's wick goes 0.05 ATR beyond a pool, the pool is removed from the map and drawn grey up to the sweep candle.
◆ WHAT MAKES IT DIFFERENT
▶ One heat score that combines stacking (equal highs/lows), volume at the swing, round numbers, touches without a break and age, instead of a plain line per swing.
▶ Magnets: the hottest pool above and below price, with a "far" magnet when one side has no pool within the view distance.
▶ The same map on every timeframe: levels are built on "Build levels on timeframe" (30 minutes by default), so 1m, 5m, 15m and 30m charts show the same pools, heat and magnets. Charts above that timeframe use their own timeframe.
▶ Measured on your chart: how often a hot sweep reversed and how often a hot magnet was reached, plus a strip of the last 12 hot sweeps.
▶ Works on any symbol: forex and CFDs use tick volume for the volume weight, and on symbols with no volume data (for example NSE indices) the volume weight switches off.
◆ THE DASHBOARD
By default the dashboard is drawn right next to the last candle. Choose "Panel (always visible)" in the settings to pin it to a corner of the screen instead. It shows:
▶ Header: where most of the heat sits (MORE LIQUIDITY ABOVE / MORE LIQUIDITY BELOW / BALANCED), NO POOLS IN VIEW, or NO POOLS ABOVE / BELOW when every tracked pool on one side has been swept.
▶ Liquidity gauge: share of heat above (red) and below (green) price within "Show levels within".
▶ MAGNET ↑ / MAGNET ↓: price, heat and distance in ATR ("far" when beyond "Show levels within").
▶ Nearest hot zone with a 10-cell heat meter.
▶ Price status: inside a hot zone, or in clear air.
▶ Last 12 hot sweeps, oldest on the left: up / solid = price reversed, down / faded = price kept going.
▶ Reversal % and Magnet hit % with the number of cases (n).

◆ EXAMPLE READINGS (IN-SAMPLE)
Default settings, levels built on 30 minutes, the history TradingView loads (checked 31 Oct 2026):
▶ OANDA XAUUSD 15m: hot sweep reversed 69% (n 311), hot magnet reached 45% (n 255).
▶ NSE NIFTY 15m: hot sweep reversed 55% (n 331), hot magnet reached 58% (n 272).
How these are counted: a "reversal" is a close back 0.5 ATR on the other side of a swept hot pool within 10 bars of the build timeframe (two pools on the same side swept by one candle count once). A "magnet hit" is price reaching a hot magnet (heat 60 or more, inside "Show levels within" and at least 1 ATR away) within 50 bars of the build timeframe; the magnets above and below are tested separately, so the hit rate is not a direction call. These counts describe the past on these charts. They are not trade results (no entry, stop, target, spread or commission), no random baseline is shown, and they are not a promise of future results. They change with symbol, timeframe and settings, so read them on your own chart.
◆ HOW TO USE
1. Look at the magnets and the liquidity gauge to see where the largest pools sit above and below price.
2. When price runs into a hot pool, watch the ⚡ sweep and the candles after it. A close back on the other side is the reversal the dashboard counts; a close that stays beyond it means price kept going (a faded bar in the sweep strip).
3. Use the Reversal % and Magnet hit % of your own symbol as context, together with your own entry, stop and target rules. The indicator only maps and measures liquidity; it does not give trade signals.
4. Test the settings and the timeframe on your own instrument before you rely on anything it shows.
◆ SETTINGS
▶ Liquidity sources: Build levels on timeframe (30), Swing length (5), Equal highs/lows tolerance (× ATR) (0.3), Weight by volume at the swing, Boost levels near round numbers, Round number step (0 = auto), Heat added per touch without break (0.3).
▶ Heat: Heat half-life (bars of the build timeframe) (150), Max active levels (120), Show levels within (× ATR of price) (16), Hide levels below heat (15).
▶ Visuals: Heat bands, Band thickness at full heat (× ATR) (0.6), Name the hot bands (heat ≥ 70), Show swept (cooled) levels, Swept levels kept (30), Heat profile on the right, Profile rows (40), Profile width (bars) (12), Extend bands right (bars) (3), Magnets (hottest level above / below), Sweep marks, Color candles inside hot zones, Path arrow to the stronger magnet (used with the panel or with no dashboard).
▶ Stats: Hot zone = heat ≥ (60), Sweep → reversal window (bars) (10 bars of the build timeframe), Reversal = close back beyond level by (× ATR) (0.5), Magnet reached within (bars) (50 bars of the build timeframe).
▶ Dashboard: Dashboard style (Beside last candle / Panel (always visible) / Off), Dashboard distance from last candle (bars) (6), Panel position, Text size.
▶ Colors: Swept (cooled) level, Sell-side liquidity (below price), Buy-side liquidity (above price).
Quick guide: fewer, bigger pools → raise "Swing length". Cleaner chart → raise "Hide levels below heat" or lower "Show levels within". More of the map visible → raise "Show levels within" (the chart zooms out to fit).
◆ ALERTS
▶ Hot buy-side liquidity swept / Hot sell-side liquidity swept
▶ Magnet above reached / Magnet below reached (a hot magnet being tested, reached within the test window)
▶ Price near magnet above / Price near magnet below (once per magnet level, on the first bar close within 0.5 ATR of it)
For one alert with details, choose "Any alert() function call": once per bar it lists every hot pool swept on that bar with its side, price and heat. All alerts are checked on bar close.
◆ LIMITATIONS
▶ Pools come from confirmed swings, so a pool appears "Swing length" bars of the build timeframe after the swing (one bar later when the chart is on the build timeframe). Pools and heat use closed bars of the build timeframe and do not repaint. A sweep is a wick 0.05 ATR beyond the pool, confirmed when your chart's bar closes. On the live bar, the dashboard, magnets and candle colour follow the current price and can change until the bar closes.
▶ Heat is relative to the hottest active pool on your chart. A heat of 80 on one symbol is not the same amount of liquidity as 80 on another.
▶ This is an estimate of where stop orders are likely to rest, built from price structure. It does not read the order book or real stop orders.
▶ Stats use only the bars loaded on your chart and change with symbol, timeframe and settings.
▶ Only the last "Swept levels kept" (30) swept levels and up to "Max active levels" (120) active pools are kept; the coldest pool is dropped first.
▶ Use a build timeframe no more than about 500 times the chart timeframe, otherwise bands start at TradingView's drawing limit on the left.
▶ The indicator does not place trades.
◆ DISCLAIMER
For education and research only. This is not financial advice. Past results on a chart do not guarantee future results.
◆ OVERVIEW
Liquidity tools usually draw a line or a box at every swing and leave you to guess which one matters. This script gives each pool a heat score from 0 to 100, so the chart answers three questions at a glance:
▶ Where is the biggest pool of liquidity above price, and below price?
▶ Is price sitting inside a hot pool right now, or in clear air?
▶ On this symbol, when a hot pool was swept, how often did price turn back?
◆ HOW TO READ THE CHART
▶ Red bands = buy-side liquidity above price (buy stops are expected above swing highs). Green bands = sell-side liquidity below price (sell stops below swing lows).
▶ Colour strength = heat. A light, thin band is a cold pool; a strong, thick band is a hot pool. Bands with heat 70 or more also get an outline and a name, for example "Buy-side liquidity 86 · ×3 · round" (×3 = three swings stacked at the same price, round = near a round number).
▶ "Hot" everywhere else (⚡ marks, candle colour, nearest hot zone, stats and alerts) means heat at or above the "Hot zone = heat ≥" setting (60).
▶ A grey band that stops at a candle = a pool that was swept (price traded through it). A ⚡ above or below that candle marks the sweep of a hot pool.
▶ MAGNET ↑ / MAGNET ↓ labels next to the candles = the hottest pool above and below price within "Show levels within" (16 ATR). If one side has no pool within that distance, the hottest pool beyond it is used, marked "far" and drawn at the edge of that distance so the chart scale stays clean.
▶ Candles take the pool's colour (red above, green below) while the close is inside a hot band.
▶ The bars on the right (after the dashboard in "Beside last candle" mode, after the bands otherwise) are the heat profile: total heat at each price row, red above price and green below.
◆ HOW THE HEAT IS BUILT
1. Pools: every confirmed swing high and swing low ("Swing length", 5 bars each side) on the build timeframe becomes a pool.
2. Stacking: a new swing within "Equal highs/lows tolerance (× ATR)" (0.3) of an existing pool on the same side joins it: its weight is added to the pool's current heat with a 50% bonus. Equal highs and equal lows therefore get hotter than single swings.
3. Weight: a swing with more volume than its 50-bar average weighs more (between 0.5x and 3x). A new pool within the same tolerance of a round number gets 1.3x (step chosen from the price size, about 25 on gold or 250 on Nifty, or set "Round number step"). Each bar of the build timeframe that touches the pool without breaking it adds "Heat added per touch without break" (0.3).
4. Decay: a pool loses half of its heat every "Heat half-life" bars of the build timeframe (150) since it was last stacked or touched, so pools that price ignores fade.
5. Heat 0-100: the weight is shown relative to the hottest active pool on a square-root scale, so one giant pool does not make every other pool look cold.
6. Sweep: when a candle's wick goes 0.05 ATR beyond a pool, the pool is removed from the map and drawn grey up to the sweep candle.
◆ WHAT MAKES IT DIFFERENT
▶ One heat score that combines stacking (equal highs/lows), volume at the swing, round numbers, touches without a break and age, instead of a plain line per swing.
▶ Magnets: the hottest pool above and below price, with a "far" magnet when one side has no pool within the view distance.
▶ The same map on every timeframe: levels are built on "Build levels on timeframe" (30 minutes by default), so 1m, 5m, 15m and 30m charts show the same pools, heat and magnets. Charts above that timeframe use their own timeframe.
▶ Measured on your chart: how often a hot sweep reversed and how often a hot magnet was reached, plus a strip of the last 12 hot sweeps.
▶ Works on any symbol: forex and CFDs use tick volume for the volume weight, and on symbols with no volume data (for example NSE indices) the volume weight switches off.
◆ THE DASHBOARD
By default the dashboard is drawn right next to the last candle. Choose "Panel (always visible)" in the settings to pin it to a corner of the screen instead. It shows:
▶ Header: where most of the heat sits (MORE LIQUIDITY ABOVE / MORE LIQUIDITY BELOW / BALANCED), NO POOLS IN VIEW, or NO POOLS ABOVE / BELOW when every tracked pool on one side has been swept.
▶ Liquidity gauge: share of heat above (red) and below (green) price within "Show levels within".
▶ MAGNET ↑ / MAGNET ↓: price, heat and distance in ATR ("far" when beyond "Show levels within").
▶ Nearest hot zone with a 10-cell heat meter.
▶ Price status: inside a hot zone, or in clear air.
▶ Last 12 hot sweeps, oldest on the left: up / solid = price reversed, down / faded = price kept going.
▶ Reversal % and Magnet hit % with the number of cases (n).
◆ EXAMPLE READINGS (IN-SAMPLE)
Default settings, levels built on 30 minutes, the history TradingView loads (checked 31 Oct 2026):
▶ OANDA XAUUSD 15m: hot sweep reversed 69% (n 311), hot magnet reached 45% (n 255).
▶ NSE NIFTY 15m: hot sweep reversed 55% (n 331), hot magnet reached 58% (n 272).
How these are counted: a "reversal" is a close back 0.5 ATR on the other side of a swept hot pool within 10 bars of the build timeframe (two pools on the same side swept by one candle count once). A "magnet hit" is price reaching a hot magnet (heat 60 or more, inside "Show levels within" and at least 1 ATR away) within 50 bars of the build timeframe; the magnets above and below are tested separately, so the hit rate is not a direction call. These counts describe the past on these charts. They are not trade results (no entry, stop, target, spread or commission), no random baseline is shown, and they are not a promise of future results. They change with symbol, timeframe and settings, so read them on your own chart.
◆ HOW TO USE
1. Look at the magnets and the liquidity gauge to see where the largest pools sit above and below price.
2. When price runs into a hot pool, watch the ⚡ sweep and the candles after it. A close back on the other side is the reversal the dashboard counts; a close that stays beyond it means price kept going (a faded bar in the sweep strip).
3. Use the Reversal % and Magnet hit % of your own symbol as context, together with your own entry, stop and target rules. The indicator only maps and measures liquidity; it does not give trade signals.
4. Test the settings and the timeframe on your own instrument before you rely on anything it shows.
◆ SETTINGS
▶ Liquidity sources: Build levels on timeframe (30), Swing length (5), Equal highs/lows tolerance (× ATR) (0.3), Weight by volume at the swing, Boost levels near round numbers, Round number step (0 = auto), Heat added per touch without break (0.3).
▶ Heat: Heat half-life (bars of the build timeframe) (150), Max active levels (120), Show levels within (× ATR of price) (16), Hide levels below heat (15).
▶ Visuals: Heat bands, Band thickness at full heat (× ATR) (0.6), Name the hot bands (heat ≥ 70), Show swept (cooled) levels, Swept levels kept (30), Heat profile on the right, Profile rows (40), Profile width (bars) (12), Extend bands right (bars) (3), Magnets (hottest level above / below), Sweep marks, Color candles inside hot zones, Path arrow to the stronger magnet (used with the panel or with no dashboard).
▶ Stats: Hot zone = heat ≥ (60), Sweep → reversal window (bars) (10 bars of the build timeframe), Reversal = close back beyond level by (× ATR) (0.5), Magnet reached within (bars) (50 bars of the build timeframe).
▶ Dashboard: Dashboard style (Beside last candle / Panel (always visible) / Off), Dashboard distance from last candle (bars) (6), Panel position, Text size.
▶ Colors: Swept (cooled) level, Sell-side liquidity (below price), Buy-side liquidity (above price).
Quick guide: fewer, bigger pools → raise "Swing length". Cleaner chart → raise "Hide levels below heat" or lower "Show levels within". More of the map visible → raise "Show levels within" (the chart zooms out to fit).
◆ ALERTS
▶ Hot buy-side liquidity swept / Hot sell-side liquidity swept
▶ Magnet above reached / Magnet below reached (a hot magnet being tested, reached within the test window)
▶ Price near magnet above / Price near magnet below (once per magnet level, on the first bar close within 0.5 ATR of it)
For one alert with details, choose "Any alert() function call": once per bar it lists every hot pool swept on that bar with its side, price and heat. All alerts are checked on bar close.
◆ LIMITATIONS
▶ Pools come from confirmed swings, so a pool appears "Swing length" bars of the build timeframe after the swing (one bar later when the chart is on the build timeframe). Pools and heat use closed bars of the build timeframe and do not repaint. A sweep is a wick 0.05 ATR beyond the pool, confirmed when your chart's bar closes. On the live bar, the dashboard, magnets and candle colour follow the current price and can change until the bar closes.
▶ Heat is relative to the hottest active pool on your chart. A heat of 80 on one symbol is not the same amount of liquidity as 80 on another.
▶ This is an estimate of where stop orders are likely to rest, built from price structure. It does not read the order book or real stop orders.
▶ Stats use only the bars loaded on your chart and change with symbol, timeframe and settings.
▶ Only the last "Swept levels kept" (30) swept levels and up to "Max active levels" (120) active pools are kept; the coldest pool is dropped first.
▶ Use a build timeframe no more than about 500 times the chart timeframe, otherwise bands start at TradingView's drawing limit on the left.
▶ The indicator does not place trades.
◆ DISCLAIMER
For education and research only. This is not financial advice. Past results on a chart do not guarantee future results.

คำจำกัดสิทธิ์ความรับผิดชอบ
ข้อมูลและบทความไม่ได้มีวัตถุประสงค์เพื่อก่อให้เกิดกิจกรรมทางการเงิน, การลงทุน, การซื้อขาย, ข้อเสนอแนะ หรือคำแนะนำประเภทอื่น ๆ ที่ให้หรือรับรองโดย TradingView อ่านเพิ่มเติมใน ข้อกำหนดการใช้งาน
คำจำกัดสิทธิ์ความรับผิดชอบ
ข้อมูลและบทความไม่ได้มีวัตถุประสงค์เพื่อก่อให้เกิดกิจกรรมทางการเงิน, การลงทุน, การซื้อขาย, ข้อเสนอแนะ หรือคำแนะนำประเภทอื่น ๆ ที่ให้หรือรับรองโดย TradingView อ่านเพิ่มเติมใน ข้อกำหนดการใช้งาน