ที่อัปเดต:
Bar Counter From Date/Time with MaxNum
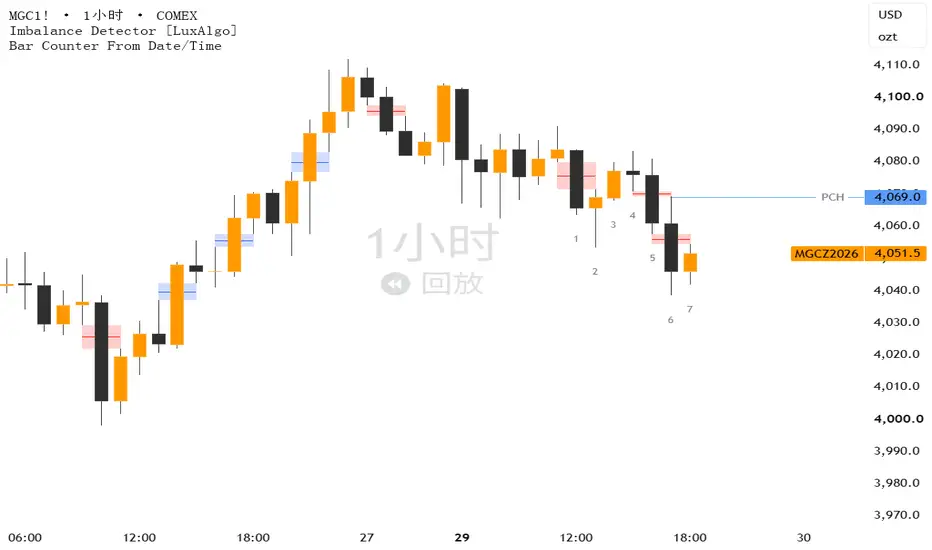
Bar Counter From Date/Time — Script Documentation
Overview
Bar Counter From Date/Time is a Pine Script® v6 indicator that counts bars starting from a user-defined date/time and displays the running count as labels directly on the chart. It is useful for marking sequential bar numbers after a specific event, session open, news release, or any custom reference point.
The script also includes an optional cap on how many counted bars are displayed, so the chart stays clean even on long histories.
Features
Count bars from any specified date and time.
Display the count as labels below each bar.
Customize label text color and font size.
Show labels only every N bars to reduce clutter.
Limit the total number of counted bars displayed on the chart.
Show the live bar count in the Data Window.
Inputs
Input Type Default Description
Start Date/Time Time 2024-01-01 00:00 The date and time from which bar counting begins. Bars before this time are ignored.
Text Color Color white Color of the label text.
Font Size String normal Size of the label text. Options: tiny, small, normal, large, huge.
Show Every N Bars Integer 1 Draws a label only every N bars. A value of 1 labels every bar. Minimum value is 1.
Max Number of Counted Bars to Display Integer 50 The maximum bar count that will be displayed. Once the count exceeds this value, no further labels are drawn. Minimum value is 1.
How It Works
1. Bar Counting
The script maintains a persistent counter (barCount) using the var keyword.
When the current bar's time is greater than or equal to the Start Date/Time, the counter begins.
The first qualifying bar is assigned a count of 1.
Each subsequent qualifying bar increments the counter by 1.
Bars before the start date/time do not affect the counter.
2. Label Size Mapping
The selected Font Size string is mapped to the corresponding Pine Script size.* constant using a switch statement.
3. Label Drawing
A label is created only when all of the following conditions are true:
The counter has a valid value (not na(barCount)).
The counter has not exceeded the Max Number of Counted Bars to Display (barCount <= maxBars).
The counter is divisible by Show Every N Bars (barCount % showEvery == 0).
When drawn, the label:
Is positioned at the current bar index.
Is anchored below the bar (yloc.belowbar).
Uses a fully transparent background (color.new(color.black, 100)).
Displays the current bar count as text.
4. Data Window Output
The script also plots barCount with display=display.data_window, so the live count is always visible in the Data Window panel regardless of the maxBars limit. This is useful for monitoring the true total count even after labels stop being drawn.
Usage Examples
Example 1 — Label every bar after a session open
Start Date/Time: 2024-01-01 09:30
Show Every N Bars: 1
Max Number of Counted Bars to Display: 100
Result: The first 100 bars after 09:30 are labeled 1 through 100.
Example 2 — Sparse labels for a long-term count
Start Date/Time: 2024-01-01 00:00
Show Every N Bars: 10
Max Number of Counted Bars to Display: 200
Result: Labels appear at counts 10, 20, 30 … 200.
Example 3 — Quick event marker
Start Date/Time: 2024-06-15 14:00
Show Every N Bars: 1
Max Number of Counted Bars to Display: 20
Result: Only the first 20 bars after the event are labeled, keeping the chart focused on the immediate aftermath.
Notes and Tips
maxBars semantics: The limit applies to the first N counted bars, not the most recent N. If you need "last N bars only," the logic would need to be inverted to delete older labels as new ones are drawn.
No labels scenario: If maxBars is smaller than showEvery, no labels may appear. For example, with maxBars = 3 and showEvery = 5, the condition barCount % 5 == 0 is never satisfied within the range. Adjust showEvery accordingly.
Time zone: The input.time value uses the exchange's time zone by default. Ensure your start time matches the chart's time zone to avoid off-by-one counting.
Performance: Labels consume chart resources. On very long histories, keep maxBars and showEvery reasonably sized.
Data Window: Even when labels stop at maxBars, the Data Window continues to show the real total count.
Overview
Bar Counter From Date/Time is a Pine Script® v6 indicator that counts bars starting from a user-defined date/time and displays the running count as labels directly on the chart. It is useful for marking sequential bar numbers after a specific event, session open, news release, or any custom reference point.
The script also includes an optional cap on how many counted bars are displayed, so the chart stays clean even on long histories.
Features
Count bars from any specified date and time.
Display the count as labels below each bar.
Customize label text color and font size.
Show labels only every N bars to reduce clutter.
Limit the total number of counted bars displayed on the chart.
Show the live bar count in the Data Window.
Inputs
Input Type Default Description
Start Date/Time Time 2024-01-01 00:00 The date and time from which bar counting begins. Bars before this time are ignored.
Text Color Color white Color of the label text.
Font Size String normal Size of the label text. Options: tiny, small, normal, large, huge.
Show Every N Bars Integer 1 Draws a label only every N bars. A value of 1 labels every bar. Minimum value is 1.
Max Number of Counted Bars to Display Integer 50 The maximum bar count that will be displayed. Once the count exceeds this value, no further labels are drawn. Minimum value is 1.
How It Works
1. Bar Counting
The script maintains a persistent counter (barCount) using the var keyword.
When the current bar's time is greater than or equal to the Start Date/Time, the counter begins.
The first qualifying bar is assigned a count of 1.
Each subsequent qualifying bar increments the counter by 1.
Bars before the start date/time do not affect the counter.
2. Label Size Mapping
The selected Font Size string is mapped to the corresponding Pine Script size.* constant using a switch statement.
3. Label Drawing
A label is created only when all of the following conditions are true:
The counter has a valid value (not na(barCount)).
The counter has not exceeded the Max Number of Counted Bars to Display (barCount <= maxBars).
The counter is divisible by Show Every N Bars (barCount % showEvery == 0).
When drawn, the label:
Is positioned at the current bar index.
Is anchored below the bar (yloc.belowbar).
Uses a fully transparent background (color.new(color.black, 100)).
Displays the current bar count as text.
4. Data Window Output
The script also plots barCount with display=display.data_window, so the live count is always visible in the Data Window panel regardless of the maxBars limit. This is useful for monitoring the true total count even after labels stop being drawn.
Usage Examples
Example 1 — Label every bar after a session open
Start Date/Time: 2024-01-01 09:30
Show Every N Bars: 1
Max Number of Counted Bars to Display: 100
Result: The first 100 bars after 09:30 are labeled 1 through 100.
Example 2 — Sparse labels for a long-term count
Start Date/Time: 2024-01-01 00:00
Show Every N Bars: 10
Max Number of Counted Bars to Display: 200
Result: Labels appear at counts 10, 20, 30 … 200.
Example 3 — Quick event marker
Start Date/Time: 2024-06-15 14:00
Show Every N Bars: 1
Max Number of Counted Bars to Display: 20
Result: Only the first 20 bars after the event are labeled, keeping the chart focused on the immediate aftermath.
Notes and Tips
maxBars semantics: The limit applies to the first N counted bars, not the most recent N. If you need "last N bars only," the logic would need to be inverted to delete older labels as new ones are drawn.
No labels scenario: If maxBars is smaller than showEvery, no labels may appear. For example, with maxBars = 3 and showEvery = 5, the condition barCount % 5 == 0 is never satisfied within the range. Adjust showEvery accordingly.
Time zone: The input.time value uses the exchange's time zone by default. Ensure your start time matches the chart's time zone to avoid off-by-one counting.
Performance: Labels consume chart resources. On very long histories, keep maxBars and showEvery reasonably sized.
Data Window: Even when labels stop at maxBars, the Data Window continues to show the real total count.
Release Note
Update Default Color and Max num
คำจำกัดสิทธิ์ความรับผิดชอบ
ข้อมูลและบทความไม่ได้มีวัตถุประสงค์เพื่อก่อให้เกิดกิจกรรมทางการเงิน, การลงทุน, การซื้อขาย, ข้อเสนอแนะ หรือคำแนะนำประเภทอื่น ๆ ที่ให้หรือรับรองโดย TradingView อ่านเพิ่มเติมใน ข้อกำหนดการใช้งาน
คำจำกัดสิทธิ์ความรับผิดชอบ
ข้อมูลและบทความไม่ได้มีวัตถุประสงค์เพื่อก่อให้เกิดกิจกรรมทางการเงิน, การลงทุน, การซื้อขาย, ข้อเสนอแนะ หรือคำแนะนำประเภทอื่น ๆ ที่ให้หรือรับรองโดย TradingView อ่านเพิ่มเติมใน ข้อกำหนดการใช้งาน