OPEN-SOURCE SCRIPT
Support & Resistance Levels
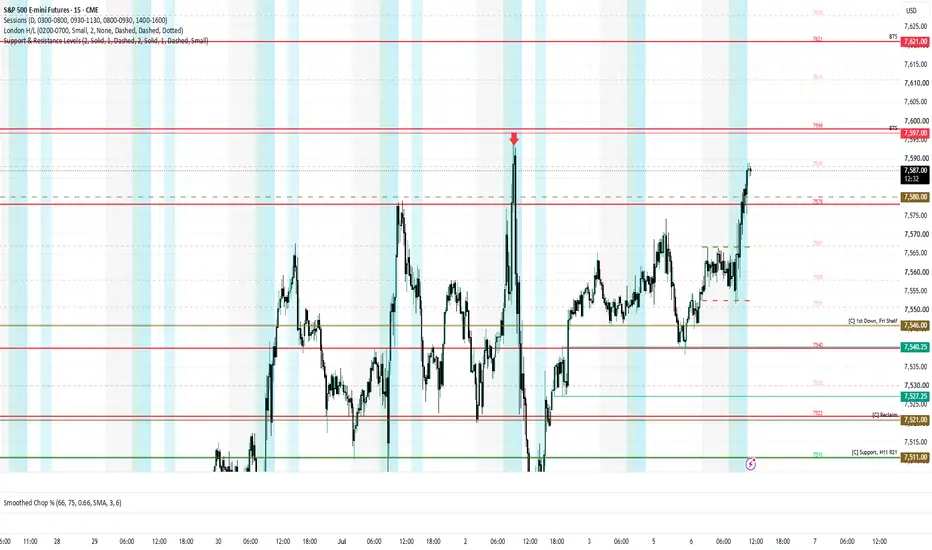
Support and resistance levels plotter created specifically for copying Adam Mancini's Newsletter levels onto your chart in one copy and paste (one for the supports and one for the resistances).
You can format the style of the support and resistance lines independently as well as the major and minor lines. You can also turn off the minor lines.
How to use:
1. copy the entire block of text for the support levels from Adam's newsletter, starting with the first support level e.g.
"
7511 (major), 7501, 7492 (major), 7482 (major), 7473, 7459, 7454 (major), 7439, 7421 (major), 7409, 7399 (major), 7390, 7382, 7374, 7369 (major), 7364, 7358 (major), 7351, 7346 (Major), 7341, 7337 (major), 7331, 7325, 7311 (major), 7303, 7294, 7288 (major), 7274, 7271 (major), 7266, 7262 (major), 7257, 7252 (major), 7244 (major), 7236, 7228, 7223 (major), 7211 (major), 7197, 7191 (major).
"
2. Open the indicator setting and paste the entire string into the input window for "supports".
3. Repeat for resistance and voila!
There is a debug table you chose to add that shows the number of support and resistance levels being parsed.
If the levels don't scroll correctly, right click on the y-axis and ensure "scale price chart only" is unchecked.
You can format the style of the support and resistance lines independently as well as the major and minor lines. You can also turn off the minor lines.
How to use:
1. copy the entire block of text for the support levels from Adam's newsletter, starting with the first support level e.g.
"
7511 (major), 7501, 7492 (major), 7482 (major), 7473, 7459, 7454 (major), 7439, 7421 (major), 7409, 7399 (major), 7390, 7382, 7374, 7369 (major), 7364, 7358 (major), 7351, 7346 (Major), 7341, 7337 (major), 7331, 7325, 7311 (major), 7303, 7294, 7288 (major), 7274, 7271 (major), 7266, 7262 (major), 7257, 7252 (major), 7244 (major), 7236, 7228, 7223 (major), 7211 (major), 7197, 7191 (major).
"
2. Open the indicator setting and paste the entire string into the input window for "supports".
3. Repeat for resistance and voila!
There is a debug table you chose to add that shows the number of support and resistance levels being parsed.
If the levels don't scroll correctly, right click on the y-axis and ensure "scale price chart only" is unchecked.
สคริปต์โอเพนซอร์ซ
ด้วยเจตนารมณ์หลักของ TradingView ผู้สร้างสคริปต์นี้ได้ทำให้เป็นโอเพนซอร์ส เพื่อให้เทรดเดอร์สามารถตรวจสอบและยืนยันฟังก์ชันการทำงานของมันได้ ขอชื่นชมผู้เขียน! แม้ว่าคุณจะใช้งานได้ฟรี แต่โปรดจำไว้ว่าการเผยแพร่โค้ดซ้ำจะต้องเป็นไปตาม กฎระเบียบการใช้งาน ของเรา

คำจำกัดสิทธิ์ความรับผิดชอบ
ข้อมูลและบทความไม่ได้มีวัตถุประสงค์เพื่อก่อให้เกิดกิจกรรมทางการเงิน, การลงทุน, การซื้อขาย, ข้อเสนอแนะ หรือคำแนะนำประเภทอื่น ๆ ที่ให้หรือรับรองโดย TradingView อ่านเพิ่มเติมใน ข้อกำหนดการใช้งาน
สคริปต์โอเพนซอร์ซ
ด้วยเจตนารมณ์หลักของ TradingView ผู้สร้างสคริปต์นี้ได้ทำให้เป็นโอเพนซอร์ส เพื่อให้เทรดเดอร์สามารถตรวจสอบและยืนยันฟังก์ชันการทำงานของมันได้ ขอชื่นชมผู้เขียน! แม้ว่าคุณจะใช้งานได้ฟรี แต่โปรดจำไว้ว่าการเผยแพร่โค้ดซ้ำจะต้องเป็นไปตาม กฎระเบียบการใช้งาน ของเรา
คำจำกัดสิทธิ์ความรับผิดชอบ
ข้อมูลและบทความไม่ได้มีวัตถุประสงค์เพื่อก่อให้เกิดกิจกรรมทางการเงิน, การลงทุน, การซื้อขาย, ข้อเสนอแนะ หรือคำแนะนำประเภทอื่น ๆ ที่ให้หรือรับรองโดย TradingView อ่านเพิ่มเติมใน ข้อกำหนดการใช้งาน