Trend-Quality Indicator [Sepiashvili 2004]
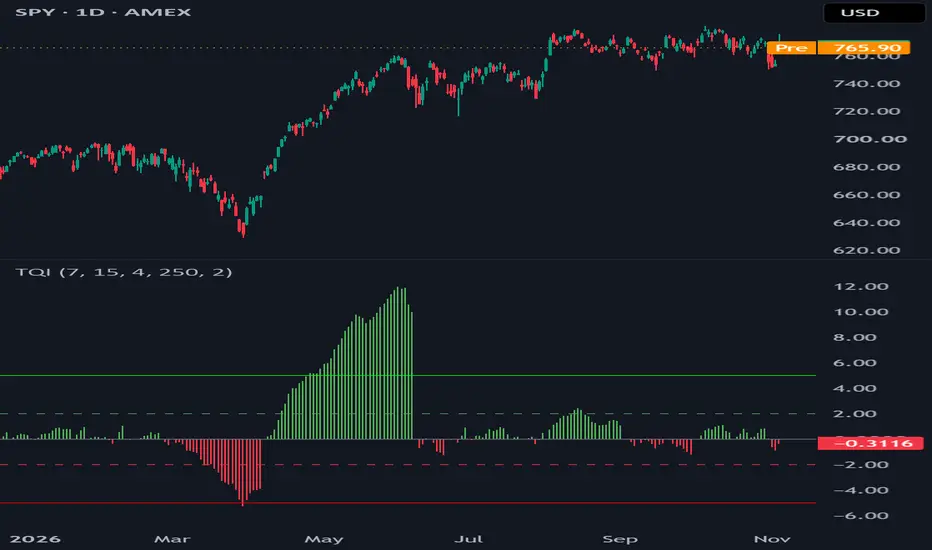
Trend-Quality Indicator (TQI) — David Sepiashvili (2004)
The Trend-Quality Indicator (TQI) was originally developed by David Sepiashvili and published in the April 2004 edition of Technical Analysis of Stocks & Commodities.
The indicator is designed to measure the quality of a price trend by comparing its cumulative directional movement against the fluctuations surrounding that movement. Essentially, it acts as a trend signal-to-noise ratio, helping distinguish relatively smooth, sustained trends from noisy or directionless price action.
Unlike conventional trend indicators that focus primarily on direction or momentum, TQI attempts to quantify how clearly directional movement stands out from short-term fluctuations.
How It Works
The calculation involves five steps:
1. Identify trend reversals: Two exponential moving averages (EMAs) identify the beginning of each new trend period. The default periods are 7 and 15.
2. Calculate cumulative price change (CPC): Price changes are accumulated from the most recent EMA crossover, measuring net directional progress.
3. Smooth the trend: A short exponential moving average is applied to CPC, resetting at each new trend period. The default smoothing length is 4.
4. Measure market noise: The root mean square (RMS) deviation between CPC and its smoothed value is calculated over a rolling window of 250 bars by default.
5. Calculate trend quality: The smoothed directional component is divided by the RMS noise, adjusted by a correction factor of 2.
The resulting oscillator is:
Q = Trend / (Correction Factor × RMS Noise)
Higher absolute values indicate that cumulative directional movement is large relative to the measured noise.
Interpreting the Indicator
The indicator plots a histogram, with positive values displayed in green and negative values in red.
• Q > 0: Positive cumulative trend direction.
• Q < 0: Negative cumulative trend direction.
• |Q| < 1: Weak directional movement relative to noise.
• |Q| between 1 and 2: Relatively weak trend quality.
• |Q| between 2 and 5: Moderate trend quality.
• |Q| > 5: Strong directional movement relative to noise.
These thresholds are approximate interpretive guidelines rather than statistically validated boundaries. Their usefulness depends on the instrument, timeframe, and calculation parameters.
For example, a stock with a Q value of +5 exhibits substantially more positive cumulative directional movement relative to its measured noise than a stock with a Q value of +1.
Importantly, a high TQI value does not necessarily indicate high momentum or predict continued price appreciation. It measures the relationship between cumulative movement and recent deviations.
Settings and Customisation
The default parameters follow the original 2004 implementation:
• Fast EMA: 7 periods
• Slow EMA: 15 periods
• Trend Length (m): 4 periods
• Noise Length (n): 250 periods
• Correction Factor (c): 2
All parameters can be adjusted to experiment with different sensitivities and timeframes. Changing these settings may also change the distribution and interpretation of Q values.
The indicator includes horizontal reference levels at zero, ±2, and ±5 to assist with visual interpretation.
Implementation and Limitations
This is an open-source Pine Script implementation of Sepiashvili's original concept, using explicit cumulative price-change tracking, EMA crossover resets, and RMS noise normalization.
The script was developed to provide a straightforward, configurable implementation of the published methodology faithful to the original publication - there are other variations of this indicator on TradingView but some change the formula slightly or are not as easy to read on the charts as this one is.
The indicator has several limitations worth considering:
• It is a descriptive indicator, not a predictive model or standalone trading system.
• EMA crossovers determine when cumulative price tracking resets, meaning results depend on the selected crossover periods.
• RMS noise is measured over a rolling historical window, so it may respond slowly to changes in volatility.
• The indicator requires sufficient historical data and an initial EMA crossover before producing valid readings.
• High trend-quality readings do not guarantee that an established trend will continue.
TQI may be useful as an additional trend-quality filter alongside momentum, moving averages, or other systematic trading criteria, but as with any tool, technique or indicator, it should be independently evaluated and tested before being incorporated into a trading strategy.
Good luck with your trading guys :)
Original reference: David Sepiashvili, "Trend-Quality Indicator," Technical Analysis of Stocks & Commodities, April 2004.
The Trend-Quality Indicator (TQI) was originally developed by David Sepiashvili and published in the April 2004 edition of Technical Analysis of Stocks & Commodities.
The indicator is designed to measure the quality of a price trend by comparing its cumulative directional movement against the fluctuations surrounding that movement. Essentially, it acts as a trend signal-to-noise ratio, helping distinguish relatively smooth, sustained trends from noisy or directionless price action.
Unlike conventional trend indicators that focus primarily on direction or momentum, TQI attempts to quantify how clearly directional movement stands out from short-term fluctuations.
How It Works
The calculation involves five steps:
1. Identify trend reversals: Two exponential moving averages (EMAs) identify the beginning of each new trend period. The default periods are 7 and 15.
2. Calculate cumulative price change (CPC): Price changes are accumulated from the most recent EMA crossover, measuring net directional progress.
3. Smooth the trend: A short exponential moving average is applied to CPC, resetting at each new trend period. The default smoothing length is 4.
4. Measure market noise: The root mean square (RMS) deviation between CPC and its smoothed value is calculated over a rolling window of 250 bars by default.
5. Calculate trend quality: The smoothed directional component is divided by the RMS noise, adjusted by a correction factor of 2.
The resulting oscillator is:
Q = Trend / (Correction Factor × RMS Noise)
Higher absolute values indicate that cumulative directional movement is large relative to the measured noise.
Interpreting the Indicator
The indicator plots a histogram, with positive values displayed in green and negative values in red.
• Q > 0: Positive cumulative trend direction.
• Q < 0: Negative cumulative trend direction.
• |Q| < 1: Weak directional movement relative to noise.
• |Q| between 1 and 2: Relatively weak trend quality.
• |Q| between 2 and 5: Moderate trend quality.
• |Q| > 5: Strong directional movement relative to noise.
These thresholds are approximate interpretive guidelines rather than statistically validated boundaries. Their usefulness depends on the instrument, timeframe, and calculation parameters.
For example, a stock with a Q value of +5 exhibits substantially more positive cumulative directional movement relative to its measured noise than a stock with a Q value of +1.
Importantly, a high TQI value does not necessarily indicate high momentum or predict continued price appreciation. It measures the relationship between cumulative movement and recent deviations.
Settings and Customisation
The default parameters follow the original 2004 implementation:
• Fast EMA: 7 periods
• Slow EMA: 15 periods
• Trend Length (m): 4 periods
• Noise Length (n): 250 periods
• Correction Factor (c): 2
All parameters can be adjusted to experiment with different sensitivities and timeframes. Changing these settings may also change the distribution and interpretation of Q values.
The indicator includes horizontal reference levels at zero, ±2, and ±5 to assist with visual interpretation.
Implementation and Limitations
This is an open-source Pine Script implementation of Sepiashvili's original concept, using explicit cumulative price-change tracking, EMA crossover resets, and RMS noise normalization.
The script was developed to provide a straightforward, configurable implementation of the published methodology faithful to the original publication - there are other variations of this indicator on TradingView but some change the formula slightly or are not as easy to read on the charts as this one is.
The indicator has several limitations worth considering:
• It is a descriptive indicator, not a predictive model or standalone trading system.
• EMA crossovers determine when cumulative price tracking resets, meaning results depend on the selected crossover periods.
• RMS noise is measured over a rolling historical window, so it may respond slowly to changes in volatility.
• The indicator requires sufficient historical data and an initial EMA crossover before producing valid readings.
• High trend-quality readings do not guarantee that an established trend will continue.
TQI may be useful as an additional trend-quality filter alongside momentum, moving averages, or other systematic trading criteria, but as with any tool, technique or indicator, it should be independently evaluated and tested before being incorporated into a trading strategy.
Good luck with your trading guys :)
Original reference: David Sepiashvili, "Trend-Quality Indicator," Technical Analysis of Stocks & Commodities, April 2004.

YouTube Lessons: rebrand.ly/zyt
My Indicators & Strategies Code: rebrand.ly/zmisc
Backtesting Course: rebrand.ly/ztst
FREE Pine Script Basics Course: rebrand.ly/zpsbc
Pine Script MASTERY Course: rebrand.ly/zpsmc
My Indicators & Strategies Code: rebrand.ly/zmisc
Backtesting Course: rebrand.ly/ztst
FREE Pine Script Basics Course: rebrand.ly/zpsbc
Pine Script MASTERY Course: rebrand.ly/zpsmc
คำจำกัดสิทธิ์ความรับผิดชอบ
ข้อมูลและบทความไม่ได้มีวัตถุประสงค์เพื่อก่อให้เกิดกิจกรรมทางการเงิน, การลงทุน, การซื้อขาย, ข้อเสนอแนะ หรือคำแนะนำประเภทอื่น ๆ ที่ให้หรือรับรองโดย TradingView อ่านเพิ่มเติมใน ข้อกำหนดการใช้งาน
YouTube Lessons: rebrand.ly/zyt
My Indicators & Strategies Code: rebrand.ly/zmisc
Backtesting Course: rebrand.ly/ztst
FREE Pine Script Basics Course: rebrand.ly/zpsbc
Pine Script MASTERY Course: rebrand.ly/zpsmc
My Indicators & Strategies Code: rebrand.ly/zmisc
Backtesting Course: rebrand.ly/ztst
FREE Pine Script Basics Course: rebrand.ly/zpsbc
Pine Script MASTERY Course: rebrand.ly/zpsmc
คำจำกัดสิทธิ์ความรับผิดชอบ
ข้อมูลและบทความไม่ได้มีวัตถุประสงค์เพื่อก่อให้เกิดกิจกรรมทางการเงิน, การลงทุน, การซื้อขาย, ข้อเสนอแนะ หรือคำแนะนำประเภทอื่น ๆ ที่ให้หรือรับรองโดย TradingView อ่านเพิ่มเติมใน ข้อกำหนดการใช้งาน