ที่อัปเดต:
CRT Turtle Soup with HTF Candles, CISD and MSS
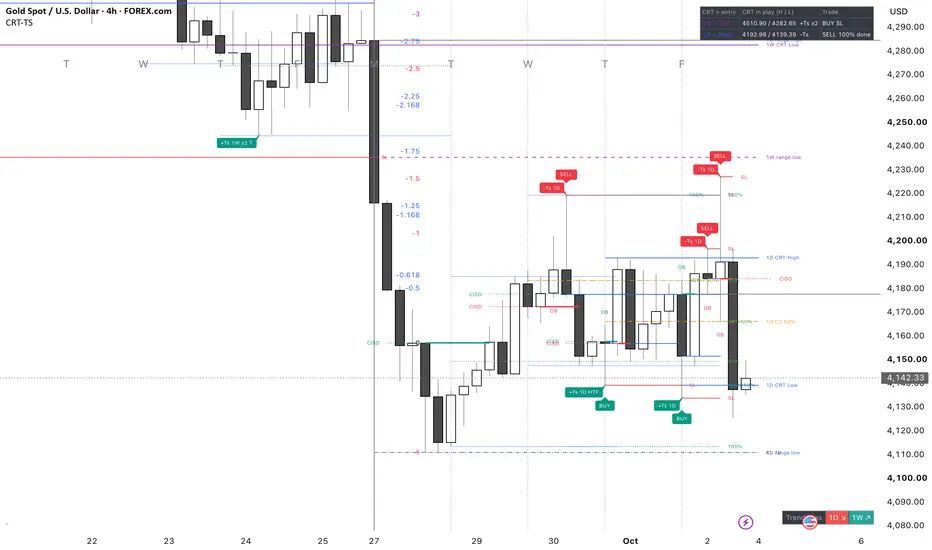
OVERVIEW
This indicator is a study tool for Candle Range Theory (CRT). It finds CRT ranges on the 1H, 4H, Daily, Weekly and Monthly candles, marks the Turtle Soup (a sweep of the range high or low that closes back inside), and shows the lower-timeframe confirmation that CRT traders wait for before acting. Higher-timeframe candles, key levels, trend bias, CISD and MSS are drawn on the same chart so the whole idea can be read in one place.
It is published free and open-source for education. It is not a trading system and it is not financial advice.
HOW A CRT RANGE IS FOUND
- A higher-timeframe candle becomes a CRT range when price later trades beyond its high or low and closes back inside. That sweep is the Turtle Soup (Ts).
- A sweep above the range that closes back inside is bearish (-Ts) and points to the CRT Low. A sweep below that closes back inside is bullish (+Ts) and points to the CRT High.
- The sweep can come on the very next candle or after inside bars.
- The range stays in play, with its CRT High, CRT Low and 50% line on the chart, until a candle of its own timeframe closes outside it. Repeat sweeps of the same end are counted on the label (x2, x3).
- The newest CRT of a timeframe is drawn in that timeframe's colour and earlier ones in a second colour.
- Higher-timeframe values are read from closed candles only.
BUY AND SELL MARKERS
Each CRT timeframe is read on a lower entry timeframe: Monthly on Daily, Weekly on 4H, Daily on 1H, 4H on 15m and 1H on 5m. These can be changed in the settings. Open the chart on the entry timeframe or lower for the CRT you are studying.
- BUY: price trades below the CRT Low and an entry-timeframe candle closes back inside the range.
- SELL: price trades above the CRT High and an entry-timeframe candle closes back inside the range.
- Order Block (OB): the last thick-bodied candle against the new direction that pierced the CRT Low or CRT High. It is labelled OB. A stricter option waits for a close beyond that candle before the marker is printed.
- Stop level: the swing point of the sweep, meaning the lowest low for a BUY and the highest high for a SELL.
- Targets: 50% of the CRT range and 100%, the opposite end of the range.
A marker is printed when the entry-timeframe candle closes and is not moved afterwards. Nothing is printed while price is only testing a CRT High or Low without sweeping it and closing back inside. Past setups stay on the chart; you choose how many.
Label tags: x2 = repeat sweep, T = formed at one of the key times (New York clock by default), HTF = the sweep also took the parent timeframe's range, KL = the sweep took a key level, ! = a higher-timeframe CRT in the opposite direction is still open.
KEY LEVELS
A key level is a swing high or swing low of a higher timeframe: a candle whose high or low is beyond both neighbouring candles. The indicator draws the untaken swings that belong to the chart timeframe: 1H swings on a 5m chart, 4H swings on a 15m to 1H chart, Daily swings on a 2H to 4H chart, Weekly swings on a Daily chart and Monthly swings on a Weekly chart. You can also type in up to three levels of your own.
HTF CANDLES
The last candles of the chosen higher timeframes are drawn to the right of the last bar, with a separate candle count for each timeframe. Each set shows:
- the timeframe name, a trend-bias arrow and the time left in the candle that is forming;
- the opening hour, day or month under each candle;
- a line at the open of the forming candle, traced back to the chart bar where it opened;
- sweep lines from the high or low of an earlier candle to the candle that traded beyond it and closed back inside;
- Fair Value Gaps and Inverse Fair Value Gaps of the HTF candles, each with a midpoint line. A selector shows gaps on the HTF candles, on the main chart, or on both.
The HTF candles are built from the chart's own bars, so they always agree with the chart.
TREND BIAS
The bias of each timeframe comes from its closed candles: a close above the previous range means up; a close below means down; a wick above with a close back inside means down; a wick below with a close back inside means up. Inside bars keep the earlier bias. It is shown as an arrow on the HTF candle label and in a small Trend Bias table.
CISD AND MSS
- CISD (Change in State of Delivery), chart timeframe. Bullish: a candle closes above the open of the latest run of down-close candles. Bearish: a candle closes below the open of the latest run of up-close candles. Only a change of direction is marked.
- MSS (Market Structure Shift), chart timeframe. Bullish: a candle closes above the last swing high while structure was bearish. Bearish: a candle closes below the last swing low while structure was bullish. The swing size is a setting.
Each is drawn as a line at the level with a short CISD or MSS label, moved clear of the candles and joined to the level by a dotted line.
DIVIDERS, DASHBOARD AND ALERTS
- Day and week dividers with the day letter (M T W T F) at the top of the chart.
- Dashboard: for each CRT timeframe, the entry timeframe in use, the CRT in play, the latest marker and its status.
- Alerts: BUY and SELL markers, Turtle Soup confirmed by the higher-timeframe close, 50% and 100% reached, stop reached, and optional alerts for CISD, MSS and a new HTF Fair Value Gap. Create one alert on the indicator with the condition "Any alert() function call".
ABOUT THE WIN RATE FIGURE
The dashboard can show a win rate. It is a plain count over the bars loaded on your chart: a marker counts as a win when price reached the 50% target before the stop level (or the 100% target, if you choose that in the settings). A marker that reached 50% and then returned to the stop is still counted as a win under the 50% setting. The figure ignores spread, commission and slippage. It is not a strategy backtest and it says nothing about future results. Treat it as a way to study how the rule behaved on the history in front of you.
HOW TO USE IT
- Pick the CRT timeframe you want to study in Master Control, for example 4H, and open a chart on its entry timeframe or lower, for example 15m.
- Read the bias and the key levels first, then wait for a sweep of a CRT High or CRT Low.
- Watch for the close back inside the range, the OB label and, if you use them, CISD or MSS in the same direction.
- Compare the stop level and the 50% and 100% levels with your own plan before doing anything.
Every feature has a switch in Master Control at the top of the settings and the same switch in its own section; a feature is on when both are ticked. Colours, line types and widths can be changed for every drawing.
LIMITS TO KNOW
- A chart timeframe higher than the entry timeframe uses the chart timeframe instead; the dashboard shows which timeframe is in use.
- The HTF candle that is still forming, its sweep mark and the time left update with price until the candle closes. The trend bias uses closed candles only.
- HTF candles and statistics cover only the history loaded on the chart. On very low timeframes the Weekly and Monthly sets may have few candles.
- TradingView allows 500 labels, 500 lines and 500 boxes per script. With many timeframes and many past setups switched on, the oldest drawings are removed first.
WHY THESE TOOLS ARE IN ONE SCRIPT
CRT is read in a fixed order: higher-timeframe range and bias, sweep of the range or of a key level, then confirmation on the lower timeframe. Each part of this script serves one step of that order, and the markers depend on the range engine, so they are kept together instead of being spread over several indicators.
CREDITS
The ideas shown here (Candle Range Theory, Turtle Soup, Order Block, Fair Value Gap, CISD and Market Structure Shift) are widely taught trading concepts and are not my invention. The layout of the HTF candle panel was inspired by the "ICT HTF Candles" indicator by fadi. All code in this script was written independently.
DISCLAIMER
This script is for education and study only. It does not give financial advice or recommendations to buy or sell. Markers and statistics describe past price behaviour under fixed rules and do not predict future results. Trading involves risk of loss. Test any idea yourself and make your own decisions.
This indicator is a study tool for Candle Range Theory (CRT). It finds CRT ranges on the 1H, 4H, Daily, Weekly and Monthly candles, marks the Turtle Soup (a sweep of the range high or low that closes back inside), and shows the lower-timeframe confirmation that CRT traders wait for before acting. Higher-timeframe candles, key levels, trend bias, CISD and MSS are drawn on the same chart so the whole idea can be read in one place.
It is published free and open-source for education. It is not a trading system and it is not financial advice.
HOW A CRT RANGE IS FOUND
- A higher-timeframe candle becomes a CRT range when price later trades beyond its high or low and closes back inside. That sweep is the Turtle Soup (Ts).
- A sweep above the range that closes back inside is bearish (-Ts) and points to the CRT Low. A sweep below that closes back inside is bullish (+Ts) and points to the CRT High.
- The sweep can come on the very next candle or after inside bars.
- The range stays in play, with its CRT High, CRT Low and 50% line on the chart, until a candle of its own timeframe closes outside it. Repeat sweeps of the same end are counted on the label (x2, x3).
- The newest CRT of a timeframe is drawn in that timeframe's colour and earlier ones in a second colour.
- Higher-timeframe values are read from closed candles only.
BUY AND SELL MARKERS
Each CRT timeframe is read on a lower entry timeframe: Monthly on Daily, Weekly on 4H, Daily on 1H, 4H on 15m and 1H on 5m. These can be changed in the settings. Open the chart on the entry timeframe or lower for the CRT you are studying.
- BUY: price trades below the CRT Low and an entry-timeframe candle closes back inside the range.
- SELL: price trades above the CRT High and an entry-timeframe candle closes back inside the range.
- Order Block (OB): the last thick-bodied candle against the new direction that pierced the CRT Low or CRT High. It is labelled OB. A stricter option waits for a close beyond that candle before the marker is printed.
- Stop level: the swing point of the sweep, meaning the lowest low for a BUY and the highest high for a SELL.
- Targets: 50% of the CRT range and 100%, the opposite end of the range.
A marker is printed when the entry-timeframe candle closes and is not moved afterwards. Nothing is printed while price is only testing a CRT High or Low without sweeping it and closing back inside. Past setups stay on the chart; you choose how many.
Label tags: x2 = repeat sweep, T = formed at one of the key times (New York clock by default), HTF = the sweep also took the parent timeframe's range, KL = the sweep took a key level, ! = a higher-timeframe CRT in the opposite direction is still open.
KEY LEVELS
A key level is a swing high or swing low of a higher timeframe: a candle whose high or low is beyond both neighbouring candles. The indicator draws the untaken swings that belong to the chart timeframe: 1H swings on a 5m chart, 4H swings on a 15m to 1H chart, Daily swings on a 2H to 4H chart, Weekly swings on a Daily chart and Monthly swings on a Weekly chart. You can also type in up to three levels of your own.
HTF CANDLES
The last candles of the chosen higher timeframes are drawn to the right of the last bar, with a separate candle count for each timeframe. Each set shows:
- the timeframe name, a trend-bias arrow and the time left in the candle that is forming;
- the opening hour, day or month under each candle;
- a line at the open of the forming candle, traced back to the chart bar where it opened;
- sweep lines from the high or low of an earlier candle to the candle that traded beyond it and closed back inside;
- Fair Value Gaps and Inverse Fair Value Gaps of the HTF candles, each with a midpoint line. A selector shows gaps on the HTF candles, on the main chart, or on both.
The HTF candles are built from the chart's own bars, so they always agree with the chart.
TREND BIAS
The bias of each timeframe comes from its closed candles: a close above the previous range means up; a close below means down; a wick above with a close back inside means down; a wick below with a close back inside means up. Inside bars keep the earlier bias. It is shown as an arrow on the HTF candle label and in a small Trend Bias table.
CISD AND MSS
- CISD (Change in State of Delivery), chart timeframe. Bullish: a candle closes above the open of the latest run of down-close candles. Bearish: a candle closes below the open of the latest run of up-close candles. Only a change of direction is marked.
- MSS (Market Structure Shift), chart timeframe. Bullish: a candle closes above the last swing high while structure was bearish. Bearish: a candle closes below the last swing low while structure was bullish. The swing size is a setting.
Each is drawn as a line at the level with a short CISD or MSS label, moved clear of the candles and joined to the level by a dotted line.
DIVIDERS, DASHBOARD AND ALERTS
- Day and week dividers with the day letter (M T W T F) at the top of the chart.
- Dashboard: for each CRT timeframe, the entry timeframe in use, the CRT in play, the latest marker and its status.
- Alerts: BUY and SELL markers, Turtle Soup confirmed by the higher-timeframe close, 50% and 100% reached, stop reached, and optional alerts for CISD, MSS and a new HTF Fair Value Gap. Create one alert on the indicator with the condition "Any alert() function call".
ABOUT THE WIN RATE FIGURE
The dashboard can show a win rate. It is a plain count over the bars loaded on your chart: a marker counts as a win when price reached the 50% target before the stop level (or the 100% target, if you choose that in the settings). A marker that reached 50% and then returned to the stop is still counted as a win under the 50% setting. The figure ignores spread, commission and slippage. It is not a strategy backtest and it says nothing about future results. Treat it as a way to study how the rule behaved on the history in front of you.
HOW TO USE IT
- Pick the CRT timeframe you want to study in Master Control, for example 4H, and open a chart on its entry timeframe or lower, for example 15m.
- Read the bias and the key levels first, then wait for a sweep of a CRT High or CRT Low.
- Watch for the close back inside the range, the OB label and, if you use them, CISD or MSS in the same direction.
- Compare the stop level and the 50% and 100% levels with your own plan before doing anything.
Every feature has a switch in Master Control at the top of the settings and the same switch in its own section; a feature is on when both are ticked. Colours, line types and widths can be changed for every drawing.
LIMITS TO KNOW
- A chart timeframe higher than the entry timeframe uses the chart timeframe instead; the dashboard shows which timeframe is in use.
- The HTF candle that is still forming, its sweep mark and the time left update with price until the candle closes. The trend bias uses closed candles only.
- HTF candles and statistics cover only the history loaded on the chart. On very low timeframes the Weekly and Monthly sets may have few candles.
- TradingView allows 500 labels, 500 lines and 500 boxes per script. With many timeframes and many past setups switched on, the oldest drawings are removed first.
WHY THESE TOOLS ARE IN ONE SCRIPT
CRT is read in a fixed order: higher-timeframe range and bias, sweep of the range or of a key level, then confirmation on the lower timeframe. Each part of this script serves one step of that order, and the markers depend on the range engine, so they are kept together instead of being spread over several indicators.
CREDITS
The ideas shown here (Candle Range Theory, Turtle Soup, Order Block, Fair Value Gap, CISD and Market Structure Shift) are widely taught trading concepts and are not my invention. The layout of the HTF candle panel was inspired by the "ICT HTF Candles" indicator by fadi. All code in this script was written independently.
DISCLAIMER
This script is for education and study only. It does not give financial advice or recommendations to buy or sell. Markers and statistics describe past price behaviour under fixed rules and do not predict future results. Trading involves risk of loss. Test any idea yourself and make your own decisions.
Release Note
CRT SUB TYPES ADDEDEach CRT formation is now classified into one of six sub types, from the order of events on the higher-timeframe candles. The rules are written for a sweep of the high; a sweep of the low is the mirror image.
- ST1: candle 2 sweeps the high and closes back inside; candle 3 reaches the low.
- ST2: the same, but the low is reached one candle later.
- ST3: candle 2 sweeps the high and reaches the low by itself.
- ST4: one or more inside candles come first, then the sweep and the delivery.
- ST5: the reversal fails. Candle 2 sweeps the high, the lower timeframe closes back inside, price does not reach the low, candle 2 closes above the high and price continues higher.
- ST6: two or more candles sweep the high, each closing back inside, before the delivery.
HOW IT IS SHOWN
- A formation is a group of candles, so it is drawn as one dashed outline around its HTF candles with the sub type at the top. A question mark means the type can still change as candles close.
- A formation is complete when price reaches the opposite end of the range.
- Optional history: every finished formation labelled on the chart at the swing point of its sweep.
- Optional count table: for each timeframe, how many formations of each sub type formed on the loaded history and how many reached 50% and 100% of the range. This is a count for study, not a success rate.
- In a type 5 formation, a BUY or SELL that turned back before 50% turns grey and stays on the chart.
SETTINGS
- New group 14 (CRT sub types) and three new switches in Master Control.
- Outline colour, line type and width can be changed; up to four formations can be outlined per timeframe.
OTHER
- Help texts were shortened and the code reorganised to stay within TradingView's script size limit. No feature was removed and saved settings keep their place.

คำจำกัดสิทธิ์ความรับผิดชอบ
ข้อมูลและบทความไม่ได้มีวัตถุประสงค์เพื่อก่อให้เกิดกิจกรรมทางการเงิน, การลงทุน, การซื้อขาย, ข้อเสนอแนะ หรือคำแนะนำประเภทอื่น ๆ ที่ให้หรือรับรองโดย TradingView อ่านเพิ่มเติมใน ข้อกำหนดการใช้งาน
คำจำกัดสิทธิ์ความรับผิดชอบ
ข้อมูลและบทความไม่ได้มีวัตถุประสงค์เพื่อก่อให้เกิดกิจกรรมทางการเงิน, การลงทุน, การซื้อขาย, ข้อเสนอแนะ หรือคำแนะนำประเภทอื่น ๆ ที่ให้หรือรับรองโดย TradingView อ่านเพิ่มเติมใน ข้อกำหนดการใช้งาน