QX Adaptive Trendline
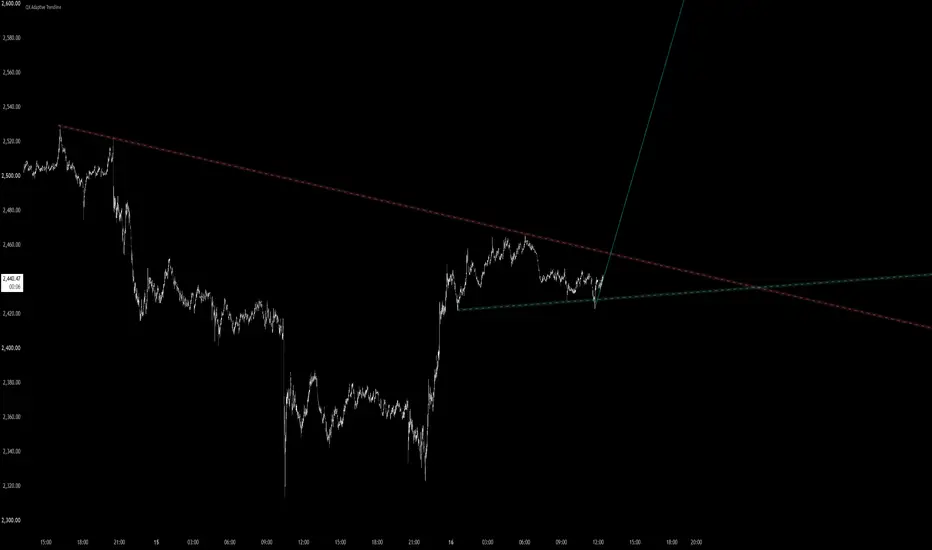
QX Adaptive Trendline
## Short description
Confirmed-pivot support and resistance trendlines with adaptive strength styling, break handling, and active-line alerts.
Full TradingView description
Overview
QX Adaptive Trendline detects rising support and falling resistance from confirmed swing pivots. It filters and ranks pivot-to-pivot candidates using configurable slope, candle-intersection, touch, and break rules, then displays primary and secondary trendlines with adaptive strength styling. Optional higher-timeframe lines and alerts help you monitor active or strong trendline structures.
Pivot confirmation introduces a delay, and the strength display is a visual heuristic—not a probability or guarantee. QX is an analysis and alerting indicator; it does not generate trade entries or exits, manage positions, or provide price targets.
### How the trendlines are calculated
1. **Confirm swing points.** Pivot highs and lows are detected using the selected left and right pivot strengths. A pivot is only available after the required right-side bars have closed, so a new line can appear several bars after its anchor formed.
2. **Build candidate lines.** Rising pairs of pivot lows are tested as support; falling pairs of pivot highs are tested as resistance.
3. **Filter candidates.** Lines must meet the minimum bar length and selected slope range. The script also checks candle bodies between the anchors against the configured ATR tolerance and body-cut allowance.
4. **Measure contacts.** Confirmed pivots near a projected line count as touches when they meet the touch tolerance and spacing rules.
5. **Rank and display.** Candidates are ranked using touch count, last-touch recency, and line span. The best and second-best eligible lines are displayed for each direction when enabled.
6. **Handle breaks.** By default, a line is removed from the active set after a confirmed wrong-side break beyond the configured buffer. You can instead keep it visible until price reclaims its original side.
### Adaptive visual strength
Support uses cyan and resistance uses purple. Each line's opacity is based on a QX strength estimate that considers additional pivot contacts, contact precision, candle-body path cleanliness, recency, rejection, and line maturity. This score is separate from the candidate ranking score.
- Stronger lines remain more vivid and can receive a wider matching-color glow.
- Weak primary lines become faint and dashed. Lines at or below the weak-strength threshold also receive a faint dashed yellow halo.
- Second-best lines are always faint and dashed, with a subtle yellow pulse to distinguish them from the primary structure.
- The yellow halo pulses on live charts as new market ticks cause the script to recalculate. Historical bars show a static faint halo.
These visual treatments describe the indicator's own heuristic estimate. They are not probabilities, forecasts, or guarantees that a line will hold. The strength estimate and visual effects do not change which candidate lines are selected or trigger alerts.
### Main settings
- **Scan Lookback Bars:** How far back to search for pivots and candidate anchors; default 500.
- **Pivot Strength Left / Right:** Bars required on either side to confirm a swing; defaults 3 / 3.
- **Slope Calculation Mode:** ATR-relative or absolute slope filtering. The default ATR-relative range is 0.015 to 0.5.
- **Minimum Line Length:** Minimum distance between anchor pivots; default 16 bars.
- **Body Intersection Tolerance / Allowed Body Cuts:** Controls how many candle-body violations are accepted between anchors. The default tolerance is 0.015 × ATR, with three allowed cuts.
- **Touch Tolerance:** Distance from a projected line at which a confirmed pivot can count as a contact; default 0.08 × ATR.
- **Broken-Line Handling:** Invalidate on a confirmed break, or show the line until price reclaims its original side.
- **Break Buffer / Minimum Break Size:** A break must exceed the greater of the ATR-based buffer and the minimum tick distance. Defaults are 0.02 × ATR and 10 ticks.
- **Break/Reclaim Basis:** Close, mid-body, or candle body edge.
- **Adaptive Strength Transparency:** Sets the opacity range for weak and strong lines; enabled by default, from 12 transparency for the strongest line to 88 for the weakest.
- **Glow Strength Threshold:** Minimum estimated strength for the matching-color glow; default 65/100.
- **Weak-Line Threshold:** Maximum estimated strength for the yellow halo; default 45/100.
- **Weak / Secondary Line Transparency:** Minimum transparency applied to weak primary and second-best lines; default 74/100.
- **Strong Trendline Alert Threshold:** Minimum QX strength score for the strong-line alerts; default 65/100. A line must also exceed the weak-line threshold. Only primary lines qualify.
- **Show Active Trendlines / Show 2nd Best Lines:** Controls the primary and secondary displayed candidates.
### Higher-timeframe trendlines
Enable **HTF Trendlines** to calculate an independent primary support and resistance line from a higher timeframe, such as 1-hour lines on a 1-minute chart. The default HTF is 1 hour. The selected timeframe must be strictly higher than the chart timeframe; otherwise the overlay stays inactive.
The HTF engine uses confirmed HTF candles and its own pivot, OHLC, ATR, touch, body-path, slope, ranking, and break history. It applies the same configurable rules as the chart-timeframe engine, with bar-based measurements made in HTF bars. HTF lines are drawn separately as dashed, translucent red resistance and green support with a soft color-matched glow. HTF lines do not change chart-timeframe candidate selection. HTF active states, projected levels, touch counts, strengths, and anchors are exposed in the Data Window.
Pivots are confirmed only after the configured right-side HTF bars close, so HTF lines can appear later than the pivot candle that forms their anchor. This confirmation delay avoids using an unfinished HTF candle in line selection.
### Alerts and scanning
Choose one of the alert frequencies:
- **Every bar close while active:** Sends a notification at each confirmed bar close while the selected line is active.
- **On line activation/change:** Sends a notification when a primary chart-timeframe or HTF line's anchor pair changes.
Alert messages identify the chart symbol and timeframe and include the active direction, projected line level, touch count, and QX strength estimate. Dynamic `alert()` messages also include the selected HTF timeframe and any active HTF lines. Create an alert using **Any alert() function call** for the dynamic message, or select one of the bullish, bearish, HTF bullish, HTF bearish, or any-line alert conditions. The HTF alert conditions direct you to the indicator inputs for the selected HTF value.
For a repeating alert that excludes weak and second-best lines, select **Strong trendline active (bullish or bearish)**. This condition is true at each confirmed chart-bar close while a primary chart-timeframe or enabled HTF line is active at or above the strong threshold and above the weak threshold. Set the alert frequency to **Once Per Bar Close**. Direction-specific strong bullish and strong bearish conditions are also available. The strong alert conditions can be added to TradingView multi-condition alerts alongside other supported conditions on the same symbol; all selected conditions must be true for the combined alert to fire. Multi-condition alerts do not use the script's `alert()` calls. [TradingView multi-condition alerts](tradingview.com/support/solutions/43000761492-multi-condition-alerts/)
The Data Window also exposes active-line state, projected price, touch count, strength, and anchor information for side-by-side chart review.
The script calculates the symbol on the chart where it is running; one instance does not continuously scan every symbol in a watchlist. Its active-state plots can be used with TradingView's Pine Screener to find symbols with a current bullish or bearish line.
### Timeframes
QX Adaptive Trendline works on the chart's selected timeframe, including 1-hour and 4-hour charts. On those charts, pivot strengths, minimum line length, lookback, and other bar-based settings are measured in 1-hour or 4-hour bars.
The HTF overlay is optional and disabled by default. On a 1-minute chart, enable it and select 1 hour or 4 hours to draw independently calculated higher-timeframe trendlines.
### Important notes
- Confirmed-pivot detection introduces an expected delay equal to the right-side pivot strength.
- New confirmed pivots can change which candidates rank first or second as the chart develops.
- HTF trendlines require the selected HTF to be higher than the chart timeframe and use confirmed HTF bars, adding the expected right-pivot confirmation delay.
- Touch, slope, body-cut, break-buffer, ranking, and strength calculations are configurable QX rules; they are not a guarantee of future support or resistance.
- This indicator is a chart-analysis and alerting tool, not investment advice. Always verify the chart context and manage risk independently.
## Short description
Confirmed-pivot support and resistance trendlines with adaptive strength styling, break handling, and active-line alerts.
Full TradingView description
Overview
QX Adaptive Trendline detects rising support and falling resistance from confirmed swing pivots. It filters and ranks pivot-to-pivot candidates using configurable slope, candle-intersection, touch, and break rules, then displays primary and secondary trendlines with adaptive strength styling. Optional higher-timeframe lines and alerts help you monitor active or strong trendline structures.
Pivot confirmation introduces a delay, and the strength display is a visual heuristic—not a probability or guarantee. QX is an analysis and alerting indicator; it does not generate trade entries or exits, manage positions, or provide price targets.
### How the trendlines are calculated
1. **Confirm swing points.** Pivot highs and lows are detected using the selected left and right pivot strengths. A pivot is only available after the required right-side bars have closed, so a new line can appear several bars after its anchor formed.
2. **Build candidate lines.** Rising pairs of pivot lows are tested as support; falling pairs of pivot highs are tested as resistance.
3. **Filter candidates.** Lines must meet the minimum bar length and selected slope range. The script also checks candle bodies between the anchors against the configured ATR tolerance and body-cut allowance.
4. **Measure contacts.** Confirmed pivots near a projected line count as touches when they meet the touch tolerance and spacing rules.
5. **Rank and display.** Candidates are ranked using touch count, last-touch recency, and line span. The best and second-best eligible lines are displayed for each direction when enabled.
6. **Handle breaks.** By default, a line is removed from the active set after a confirmed wrong-side break beyond the configured buffer. You can instead keep it visible until price reclaims its original side.
### Adaptive visual strength
Support uses cyan and resistance uses purple. Each line's opacity is based on a QX strength estimate that considers additional pivot contacts, contact precision, candle-body path cleanliness, recency, rejection, and line maturity. This score is separate from the candidate ranking score.
- Stronger lines remain more vivid and can receive a wider matching-color glow.
- Weak primary lines become faint and dashed. Lines at or below the weak-strength threshold also receive a faint dashed yellow halo.
- Second-best lines are always faint and dashed, with a subtle yellow pulse to distinguish them from the primary structure.
- The yellow halo pulses on live charts as new market ticks cause the script to recalculate. Historical bars show a static faint halo.
These visual treatments describe the indicator's own heuristic estimate. They are not probabilities, forecasts, or guarantees that a line will hold. The strength estimate and visual effects do not change which candidate lines are selected or trigger alerts.
### Main settings
- **Scan Lookback Bars:** How far back to search for pivots and candidate anchors; default 500.
- **Pivot Strength Left / Right:** Bars required on either side to confirm a swing; defaults 3 / 3.
- **Slope Calculation Mode:** ATR-relative or absolute slope filtering. The default ATR-relative range is 0.015 to 0.5.
- **Minimum Line Length:** Minimum distance between anchor pivots; default 16 bars.
- **Body Intersection Tolerance / Allowed Body Cuts:** Controls how many candle-body violations are accepted between anchors. The default tolerance is 0.015 × ATR, with three allowed cuts.
- **Touch Tolerance:** Distance from a projected line at which a confirmed pivot can count as a contact; default 0.08 × ATR.
- **Broken-Line Handling:** Invalidate on a confirmed break, or show the line until price reclaims its original side.
- **Break Buffer / Minimum Break Size:** A break must exceed the greater of the ATR-based buffer and the minimum tick distance. Defaults are 0.02 × ATR and 10 ticks.
- **Break/Reclaim Basis:** Close, mid-body, or candle body edge.
- **Adaptive Strength Transparency:** Sets the opacity range for weak and strong lines; enabled by default, from 12 transparency for the strongest line to 88 for the weakest.
- **Glow Strength Threshold:** Minimum estimated strength for the matching-color glow; default 65/100.
- **Weak-Line Threshold:** Maximum estimated strength for the yellow halo; default 45/100.
- **Weak / Secondary Line Transparency:** Minimum transparency applied to weak primary and second-best lines; default 74/100.
- **Strong Trendline Alert Threshold:** Minimum QX strength score for the strong-line alerts; default 65/100. A line must also exceed the weak-line threshold. Only primary lines qualify.
- **Show Active Trendlines / Show 2nd Best Lines:** Controls the primary and secondary displayed candidates.
### Higher-timeframe trendlines
Enable **HTF Trendlines** to calculate an independent primary support and resistance line from a higher timeframe, such as 1-hour lines on a 1-minute chart. The default HTF is 1 hour. The selected timeframe must be strictly higher than the chart timeframe; otherwise the overlay stays inactive.
The HTF engine uses confirmed HTF candles and its own pivot, OHLC, ATR, touch, body-path, slope, ranking, and break history. It applies the same configurable rules as the chart-timeframe engine, with bar-based measurements made in HTF bars. HTF lines are drawn separately as dashed, translucent red resistance and green support with a soft color-matched glow. HTF lines do not change chart-timeframe candidate selection. HTF active states, projected levels, touch counts, strengths, and anchors are exposed in the Data Window.
Pivots are confirmed only after the configured right-side HTF bars close, so HTF lines can appear later than the pivot candle that forms their anchor. This confirmation delay avoids using an unfinished HTF candle in line selection.
### Alerts and scanning
Choose one of the alert frequencies:
- **Every bar close while active:** Sends a notification at each confirmed bar close while the selected line is active.
- **On line activation/change:** Sends a notification when a primary chart-timeframe or HTF line's anchor pair changes.
Alert messages identify the chart symbol and timeframe and include the active direction, projected line level, touch count, and QX strength estimate. Dynamic `alert()` messages also include the selected HTF timeframe and any active HTF lines. Create an alert using **Any alert() function call** for the dynamic message, or select one of the bullish, bearish, HTF bullish, HTF bearish, or any-line alert conditions. The HTF alert conditions direct you to the indicator inputs for the selected HTF value.
For a repeating alert that excludes weak and second-best lines, select **Strong trendline active (bullish or bearish)**. This condition is true at each confirmed chart-bar close while a primary chart-timeframe or enabled HTF line is active at or above the strong threshold and above the weak threshold. Set the alert frequency to **Once Per Bar Close**. Direction-specific strong bullish and strong bearish conditions are also available. The strong alert conditions can be added to TradingView multi-condition alerts alongside other supported conditions on the same symbol; all selected conditions must be true for the combined alert to fire. Multi-condition alerts do not use the script's `alert()` calls. [TradingView multi-condition alerts](tradingview.com/support/solutions/43000761492-multi-condition-alerts/)
The Data Window also exposes active-line state, projected price, touch count, strength, and anchor information for side-by-side chart review.
The script calculates the symbol on the chart where it is running; one instance does not continuously scan every symbol in a watchlist. Its active-state plots can be used with TradingView's Pine Screener to find symbols with a current bullish or bearish line.
### Timeframes
QX Adaptive Trendline works on the chart's selected timeframe, including 1-hour and 4-hour charts. On those charts, pivot strengths, minimum line length, lookback, and other bar-based settings are measured in 1-hour or 4-hour bars.
The HTF overlay is optional and disabled by default. On a 1-minute chart, enable it and select 1 hour or 4 hours to draw independently calculated higher-timeframe trendlines.
### Important notes
- Confirmed-pivot detection introduces an expected delay equal to the right-side pivot strength.
- New confirmed pivots can change which candidates rank first or second as the chart develops.
- HTF trendlines require the selected HTF to be higher than the chart timeframe and use confirmed HTF bars, adding the expected right-pivot confirmation delay.
- Touch, slope, body-cut, break-buffer, ranking, and strength calculations are configurable QX rules; they are not a guarantee of future support or resistance.
- This indicator is a chart-analysis and alerting tool, not investment advice. Always verify the chart context and manage risk independently.

คำจำกัดสิทธิ์ความรับผิดชอบ
ข้อมูลและบทความไม่ได้มีวัตถุประสงค์เพื่อก่อให้เกิดกิจกรรมทางการเงิน, การลงทุน, การซื้อขาย, ข้อเสนอแนะ หรือคำแนะนำประเภทอื่น ๆ ที่ให้หรือรับรองโดย TradingView อ่านเพิ่มเติมใน ข้อกำหนดการใช้งาน
คำจำกัดสิทธิ์ความรับผิดชอบ
ข้อมูลและบทความไม่ได้มีวัตถุประสงค์เพื่อก่อให้เกิดกิจกรรมทางการเงิน, การลงทุน, การซื้อขาย, ข้อเสนอแนะ หรือคำแนะนำประเภทอื่น ๆ ที่ให้หรือรับรองโดย TradingView อ่านเพิ่มเติมใน ข้อกำหนดการใช้งาน