OPEN-SOURCE SCRIPT
ที่อัปเดต: Cumulative Volume Delta
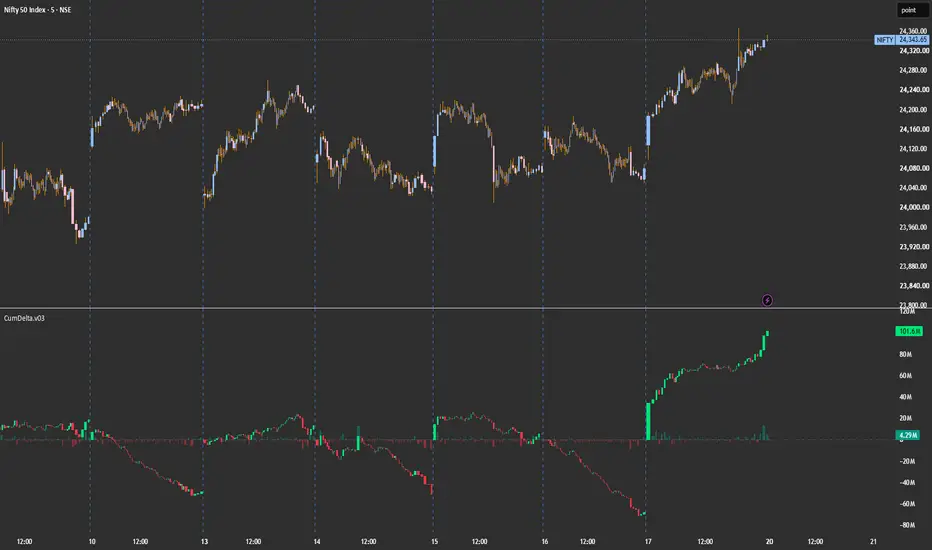
CumDelta — Cumulative Volume Delta with Session Reset
A clean cumulative volume delta (CVD) indicator that visualizes the running balance of buying vs. selling aggression using lower-timeframe up/down volume. Designed for intraday traders who want to read order flow alongside price.
What it does
Each bar's delta is calculated by pulling lower-timeframe volume data and classifying it as buying or selling pressure based on whether each sub-bar closed up or down. These per-bar deltas are then cumulated into a running total that resets on your chosen schedule (day, session, week, month, year, or N bars back).
The cumulative delta is rendered as candles — each candle's open chains from the previous close, and the body shows whether net flow on that bar was positive or negative. A histogram below shows the raw per-bar delta for quick reference.
How to read it
Rising green candles — sustained buying pressure
Falling red candles — sustained selling pressure
Divergence vs. price — price makes a new high but CVD doesn't (or vice versa) often precedes reversals
Reset bars (optional yellow highlight) — fresh session start, useful for marking where the cumulation restarts
Settings
Reset Period — Day, Session (RTH-aware), Week, Month, Year, or Bars Back
Lower Timeframe — auto-selects based on chart TF, or set manually for finer/coarser resolution
Doji Handling — choose how to attribute volume when a bar closes flat (Split 50/50, Up, Down, or Skip)
Display toggles — bar delta histogram, cumulative candles, reset markers
A clean cumulative volume delta (CVD) indicator that visualizes the running balance of buying vs. selling aggression using lower-timeframe up/down volume. Designed for intraday traders who want to read order flow alongside price.
What it does
Each bar's delta is calculated by pulling lower-timeframe volume data and classifying it as buying or selling pressure based on whether each sub-bar closed up or down. These per-bar deltas are then cumulated into a running total that resets on your chosen schedule (day, session, week, month, year, or N bars back).
The cumulative delta is rendered as candles — each candle's open chains from the previous close, and the body shows whether net flow on that bar was positive or negative. A histogram below shows the raw per-bar delta for quick reference.
How to read it
Rising green candles — sustained buying pressure
Falling red candles — sustained selling pressure
Divergence vs. price — price makes a new high but CVD doesn't (or vice versa) often precedes reversals
Reset bars (optional yellow highlight) — fresh session start, useful for marking where the cumulation restarts
Settings
Reset Period — Day, Session (RTH-aware), Week, Month, Year, or Bars Back
Lower Timeframe — auto-selects based on chart TF, or set manually for finer/coarser resolution
Doji Handling — choose how to attribute volume when a bar closes flat (Split 50/50, Up, Down, or Skip)
Display toggles — bar delta histogram, cumulative candles, reset markers
Release Note
-Bug Fixสคริปต์แบบโอเพนซอร์ส
ด้วยเจตนารมณ์หลักของ TradingView ผู้สร้างสคริปต์นี้ได้ทำให้เป็นโอเพนซอร์ส เพื่อให้เทรดเดอร์สามารถตรวจสอบและยืนยันฟังก์ชันการทำงานของมันได้ ขอชื่นชมผู้เขียน! แม้ว่าคุณจะใช้งานได้ฟรี แต่โปรดจำไว้ว่าการเผยแพร่โค้ดซ้ำจะต้องเป็นไปตาม กฎระเบียบการใช้งาน ของเรา

คำจำกัดสิทธิ์ความรับผิดชอบ
ข้อมูลและบทความไม่ได้มีวัตถุประสงค์เพื่อก่อให้เกิดกิจกรรมทางการเงิน, การลงทุน, การซื้อขาย, ข้อเสนอแนะ หรือคำแนะนำประเภทอื่น ๆ ที่ให้หรือรับรองโดย TradingView อ่านเพิ่มเติมใน ข้อกำหนดการใช้งาน
สคริปต์แบบโอเพนซอร์ส
ด้วยเจตนารมณ์หลักของ TradingView ผู้สร้างสคริปต์นี้ได้ทำให้เป็นโอเพนซอร์ส เพื่อให้เทรดเดอร์สามารถตรวจสอบและยืนยันฟังก์ชันการทำงานของมันได้ ขอชื่นชมผู้เขียน! แม้ว่าคุณจะใช้งานได้ฟรี แต่โปรดจำไว้ว่าการเผยแพร่โค้ดซ้ำจะต้องเป็นไปตาม กฎระเบียบการใช้งาน ของเรา
คำจำกัดสิทธิ์ความรับผิดชอบ
ข้อมูลและบทความไม่ได้มีวัตถุประสงค์เพื่อก่อให้เกิดกิจกรรมทางการเงิน, การลงทุน, การซื้อขาย, ข้อเสนอแนะ หรือคำแนะนำประเภทอื่น ๆ ที่ให้หรือรับรองโดย TradingView อ่านเพิ่มเติมใน ข้อกำหนดการใช้งาน