OPEN-SOURCE SCRIPT
ที่อัปเดต: Multi-Timeframe Candle Analysis [by Oberlunar]
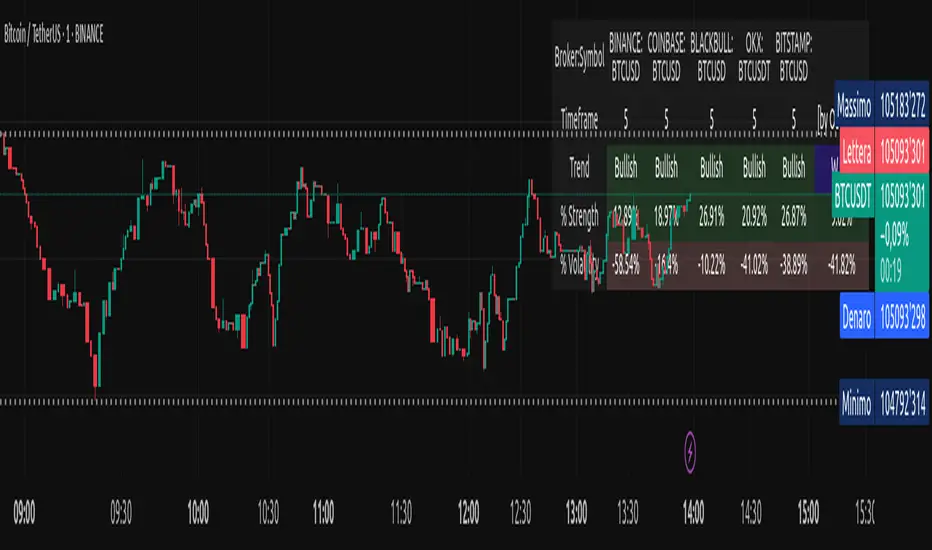
Multi-Timeframe Candle Analysis
[by Oberlunar]
Scalping often requires traders to make rapid decisions based on price movements within a short timeframe. However, a key challenge is understanding the broader trend and market pressure across higher timeframes without cluttering the workspace with multiple charts. This can lead to a lack of clarity, missed opportunities, or poorly timed trades.
The Multi-Timeframe Candle Analysis script addresses this challenge by providing a consolidated view of essential information across multiple timeframes in a single interface. This script calculates and displays the volatility, strength, and type (bullish or bearish) of candles for up to six customizable timeframes. With this data presented in a neat table, traders can quickly assess market conditions without the need to open multiple charts.
How It Works
The script analyzes six user-defined timeframes, ranging from intraday intervals (e.g., 15 or 30 minutes) to daily or even weekly periods. It extracts critical data such as open, high, low, and close prices for the current and previous candles. From this data, the script computes:
These metrics are organized into an easy-to-read table that updates dynamically as the market moves. The table color codes bullish and bearish candles for quick visual recognition, enhancing decision-making speed.
[by Oberlunar]
Scalping often requires traders to make rapid decisions based on price movements within a short timeframe. However, a key challenge is understanding the broader trend and market pressure across higher timeframes without cluttering the workspace with multiple charts. This can lead to a lack of clarity, missed opportunities, or poorly timed trades.
The Multi-Timeframe Candle Analysis script addresses this challenge by providing a consolidated view of essential information across multiple timeframes in a single interface. This script calculates and displays the volatility, strength, and type (bullish or bearish) of candles for up to six customizable timeframes. With this data presented in a neat table, traders can quickly assess market conditions without the need to open multiple charts.
How It Works
The script analyzes six user-defined timeframes, ranging from intraday intervals (e.g., 15 or 30 minutes) to daily or even weekly periods. It extracts critical data such as open, high, low, and close prices for the current and previous candles. From this data, the script computes:
- Candle Type: Identifies whether the candle is bullish or bearish based on the close relative to the open.
- Volatility Percentage Change: Measures the percentage change in candle volatility compared to the previous candle.
- Candle Strength: Evaluates the strength of price movements within the candle relative to the previous one.
These metrics are organized into an easy-to-read table that updates dynamically as the market moves. The table color codes bullish and bearish candles for quick visual recognition, enhancing decision-making speed.
Release Note
small bug fixRelease Note
The script is now more robust with respect to the NA.Release Note
added color dynamicsRelease Note
another bug fix, sorry.Release Note
bug fxRelease Note
color bug fixRelease Note
v2Release Note
some improvements...Release Note
Some small color fix, fully personalizableRelease Note
added option for the table positioningRelease Note
added some corrections in the labelsRelease Note
The script now not only analyzes multiple timeframes, but also allows you to select both the broker and the instrument to monitor — either from a predefined list or by entering them manually. Each row in the table can refer to a different asset, providing a fully customizable multi-broker, multi-instrument, multi-timeframe overview.Release Note
Now you can select any instrument in the cross-broker setup.Release Note
Added a buffer window to weigh the last variations against the previous ones,the parameter is Window Length.
Release Note
Bug fix in resetting the buffer when you change the window.Release Note
small bug fix, sorry.สคริปต์แบบโอเพนซอร์ส
ด้วยเจตนารมณ์หลักของ TradingView ผู้สร้างสคริปต์นี้ได้ทำให้เป็นโอเพนซอร์ส เพื่อให้เทรดเดอร์สามารถตรวจสอบและยืนยันฟังก์ชันการทำงานของมันได้ ขอชื่นชมผู้เขียน! แม้ว่าคุณจะใช้งานได้ฟรี แต่โปรดจำไว้ว่าการเผยแพร่โค้ดซ้ำจะต้องเป็นไปตาม กฎระเบียบการใช้งาน ของเรา

Founder of UnconventionalTraders, a platform for 0DTE/ORB analysis:
unconventionaltraders.com
unconventionaltraders.com
คำจำกัดสิทธิ์ความรับผิดชอบ
ข้อมูลและบทความไม่ได้มีวัตถุประสงค์เพื่อก่อให้เกิดกิจกรรมทางการเงิน, การลงทุน, การซื้อขาย, ข้อเสนอแนะ หรือคำแนะนำประเภทอื่น ๆ ที่ให้หรือรับรองโดย TradingView อ่านเพิ่มเติมใน ข้อกำหนดการใช้งาน
สคริปต์แบบโอเพนซอร์ส
ด้วยเจตนารมณ์หลักของ TradingView ผู้สร้างสคริปต์นี้ได้ทำให้เป็นโอเพนซอร์ส เพื่อให้เทรดเดอร์สามารถตรวจสอบและยืนยันฟังก์ชันการทำงานของมันได้ ขอชื่นชมผู้เขียน! แม้ว่าคุณจะใช้งานได้ฟรี แต่โปรดจำไว้ว่าการเผยแพร่โค้ดซ้ำจะต้องเป็นไปตาม กฎระเบียบการใช้งาน ของเรา
Founder of UnconventionalTraders, a platform for 0DTE/ORB analysis:
unconventionaltraders.com
unconventionaltraders.com
คำจำกัดสิทธิ์ความรับผิดชอบ
ข้อมูลและบทความไม่ได้มีวัตถุประสงค์เพื่อก่อให้เกิดกิจกรรมทางการเงิน, การลงทุน, การซื้อขาย, ข้อเสนอแนะ หรือคำแนะนำประเภทอื่น ๆ ที่ให้หรือรับรองโดย TradingView อ่านเพิ่มเติมใน ข้อกำหนดการใช้งาน