Semi-Markov Trend [MiesOnCharts]
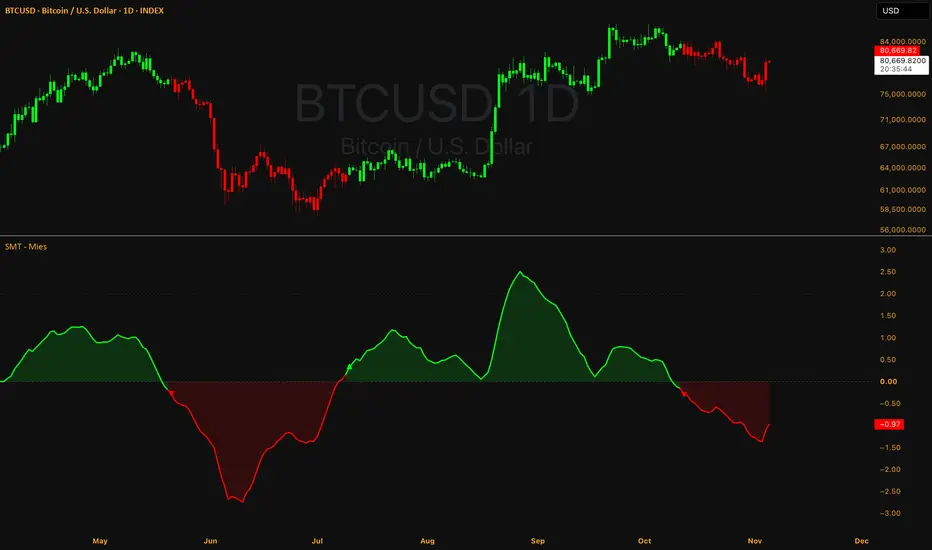
SEMI-MARKOV TREND
Semi-Markov Trend is a trend following oscillator for crypto. Its weights are derived from a regime model instead of being picked by hand: returns switch between a bull and a bear regime, and a regime gets more likely to end as it ages. The idea comes from Zakamulin and Giner's paper "Optimal Trend Following Rules in Two-State Regime-Switching Models". This script does its own derivation and solves the weights from the settings you choose.
How it works
- The model. A regime walks through a number of hidden stages, leaving each one with a constant chance per bar, then hands over to the other regime. With one stage a regime has no memory of its age, which is the plain Markov case. With more stages a young regime is unlikely to end and an old one is likely to.
- The weights. The model fixes how returns relate to each other at every lag. That gives a set of equations whose solution is the linear filter with the smallest next bar forecast error under the model. They are solved once, on the first bar.
- Smoothing. The solved weights lean hard on the latest bars, which makes the line jumpy, so an EMA is folded into them. This is a practical addition. With it on, the filter is no longer strictly the forecast optimum.
- The score. The weighted sum of past log returns is divided by current volatility and by the size of the weights:
score = sum(w[k] x r[k]) / (sigma x sqrt(sum(w[k]^2)))
r[k] is the log return k bars ago and sigma is the current volatility. The score is in standard deviations of what the sum would do on a random walk, so it reads the same way across assets.
Why it looks like MACD
With aging and smoothing on, recent returns get positive weights that rise to a peak a few bars back and then fall. That is the hump a MACD of price puts on past returns. Older returns then get negative weights, because a long run of old gains suggests the regime is aged and closer to ending. A MACD of price never does that. With one stage and no smoothing, the filter reduces to an EMA of returns.
Reading it
- Long: the score closes above the long level.
- Short: the score closes below the short level.
- Between the two levels the last state holds, so a reading hovering near zero does not flip on every bar.
The optional panel shows the score, the state, how many bars it has held, and where the weights peak and turn negative for your settings.
Settings
- Typical bull and bear length: how long each regime lasts in the model. Together they set how far back the filter reaches.
- Regime aging: how strongly age raises the chance of a regime ending.
- Regime strength: how far apart the average bull and bear bars are. Higher shortens the filter's memory and flips more often.
- Smoothing: higher gives a calmer line and fewer flips, and the state turns later.
- Volatility window: changes the scale of the line, not the weights.
- Long and short levels, source, and display options.
Alerts and repainting
There is one alert for long and one for short. The state, candle colours and alerts only change on a closed bar, and a state shown on a past bar does not change afterwards. On the live bar the line itself moves with price. The line starts once the filter has its full reach of history, so a newly listed coin stays blank for a while.
This script is for informational and educational purposes only and is not financial advice.
Semi-Markov Trend is a trend following oscillator for crypto. Its weights are derived from a regime model instead of being picked by hand: returns switch between a bull and a bear regime, and a regime gets more likely to end as it ages. The idea comes from Zakamulin and Giner's paper "Optimal Trend Following Rules in Two-State Regime-Switching Models". This script does its own derivation and solves the weights from the settings you choose.
How it works
- The model. A regime walks through a number of hidden stages, leaving each one with a constant chance per bar, then hands over to the other regime. With one stage a regime has no memory of its age, which is the plain Markov case. With more stages a young regime is unlikely to end and an old one is likely to.
- The weights. The model fixes how returns relate to each other at every lag. That gives a set of equations whose solution is the linear filter with the smallest next bar forecast error under the model. They are solved once, on the first bar.
- Smoothing. The solved weights lean hard on the latest bars, which makes the line jumpy, so an EMA is folded into them. This is a practical addition. With it on, the filter is no longer strictly the forecast optimum.
- The score. The weighted sum of past log returns is divided by current volatility and by the size of the weights:
score = sum(w[k] x r[k]) / (sigma x sqrt(sum(w[k]^2)))
r[k] is the log return k bars ago and sigma is the current volatility. The score is in standard deviations of what the sum would do on a random walk, so it reads the same way across assets.
Why it looks like MACD
With aging and smoothing on, recent returns get positive weights that rise to a peak a few bars back and then fall. That is the hump a MACD of price puts on past returns. Older returns then get negative weights, because a long run of old gains suggests the regime is aged and closer to ending. A MACD of price never does that. With one stage and no smoothing, the filter reduces to an EMA of returns.
Reading it
- Long: the score closes above the long level.
- Short: the score closes below the short level.
- Between the two levels the last state holds, so a reading hovering near zero does not flip on every bar.
The optional panel shows the score, the state, how many bars it has held, and where the weights peak and turn negative for your settings.
Settings
- Typical bull and bear length: how long each regime lasts in the model. Together they set how far back the filter reaches.
- Regime aging: how strongly age raises the chance of a regime ending.
- Regime strength: how far apart the average bull and bear bars are. Higher shortens the filter's memory and flips more often.
- Smoothing: higher gives a calmer line and fewer flips, and the state turns later.
- Volatility window: changes the scale of the line, not the weights.
- Long and short levels, source, and display options.
Alerts and repainting
There is one alert for long and one for short. The state, candle colours and alerts only change on a closed bar, and a state shown on a past bar does not change afterwards. On the live bar the line itself moves with price. The line starts once the filter has its full reach of history, so a newly listed coin stays blank for a while.
This script is for informational and educational purposes only and is not financial advice.

คำจำกัดสิทธิ์ความรับผิดชอบ
ข้อมูลและบทความไม่ได้มีวัตถุประสงค์เพื่อก่อให้เกิดกิจกรรมทางการเงิน, การลงทุน, การซื้อขาย, ข้อเสนอแนะ หรือคำแนะนำประเภทอื่น ๆ ที่ให้หรือรับรองโดย TradingView อ่านเพิ่มเติมใน ข้อกำหนดการใช้งาน
คำจำกัดสิทธิ์ความรับผิดชอบ
ข้อมูลและบทความไม่ได้มีวัตถุประสงค์เพื่อก่อให้เกิดกิจกรรมทางการเงิน, การลงทุน, การซื้อขาย, ข้อเสนอแนะ หรือคำแนะนำประเภทอื่น ๆ ที่ให้หรือรับรองโดย TradingView อ่านเพิ่มเติมใน ข้อกำหนดการใช้งาน