OPEN-SOURCE SCRIPT
Real Price vs CPI Target (base 2021)
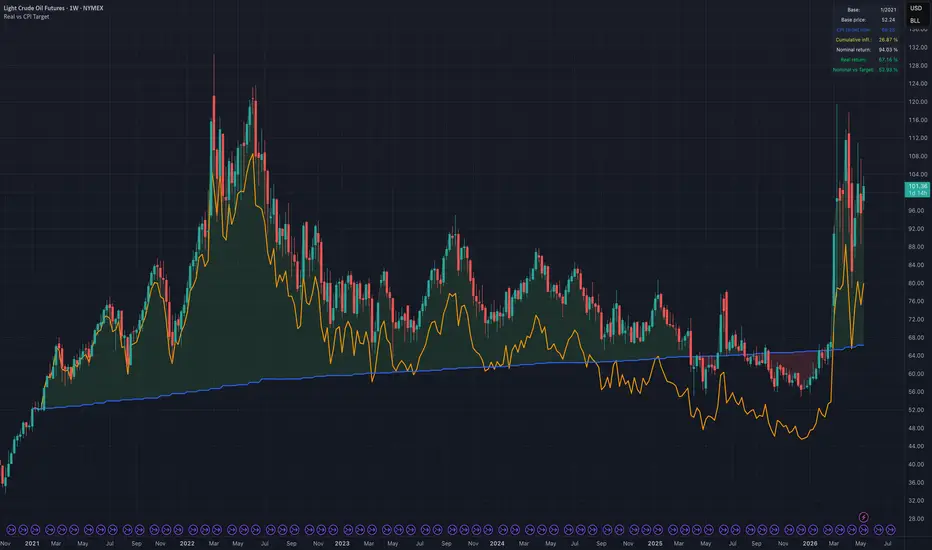
An overlay indicator that shows how an asset performs against US CPI inflation from a user-defined base date.
Three lines are plotted on the price chart:
Nominal Price (gray) — the actual quoted price
Real Price (orange) — current price in base-period purchasing power
CPI Target (blue) — what the price would be today if it had kept pace with inflation
The shaded area between nominal price and CPI target turns green when the asset beats inflation and red when it lags, giving an immediate visual read on real performance.
A summary table reports base price, CPI target, cumulative inflation, nominal return, real return, and the exact Fisher ratio between nominal price and CPI target.
Default CPI source: FRED:CPIAUCSL. Can be swapped for any monthly CPI series (e.g. ECONOMICS:ESCPI for Spain, ECONOMICS:ROCPI for Romania). Useful for comparing nominal vs inflation-adjusted highs, evaluating real returns across the 2021–2026 inflation cycle, and inflation-aware asset allocation.
Three lines are plotted on the price chart:
Nominal Price (gray) — the actual quoted price
Real Price (orange) — current price in base-period purchasing power
CPI Target (blue) — what the price would be today if it had kept pace with inflation
The shaded area between nominal price and CPI target turns green when the asset beats inflation and red when it lags, giving an immediate visual read on real performance.
A summary table reports base price, CPI target, cumulative inflation, nominal return, real return, and the exact Fisher ratio between nominal price and CPI target.
Default CPI source: FRED:CPIAUCSL. Can be swapped for any monthly CPI series (e.g. ECONOMICS:ESCPI for Spain, ECONOMICS:ROCPI for Romania). Useful for comparing nominal vs inflation-adjusted highs, evaluating real returns across the 2021–2026 inflation cycle, and inflation-aware asset allocation.
สคริปต์แบบโอเพนซอร์ส
ด้วยเจตนารมณ์หลักของ TradingView ผู้สร้างสคริปต์นี้ได้ทำให้เป็นโอเพนซอร์ส เพื่อให้เทรดเดอร์สามารถตรวจสอบและยืนยันฟังก์ชันการทำงานของมันได้ ขอชื่นชมผู้เขียน! แม้ว่าคุณจะใช้งานได้ฟรี แต่โปรดจำไว้ว่าการเผยแพร่โค้ดซ้ำจะต้องเป็นไปตาม กฎระเบียบการใช้งาน ของเรา

คำจำกัดสิทธิ์ความรับผิดชอบ
ข้อมูลและบทความไม่ได้มีวัตถุประสงค์เพื่อก่อให้เกิดกิจกรรมทางการเงิน, การลงทุน, การซื้อขาย, ข้อเสนอแนะ หรือคำแนะนำประเภทอื่น ๆ ที่ให้หรือรับรองโดย TradingView อ่านเพิ่มเติมใน ข้อกำหนดการใช้งาน
สคริปต์แบบโอเพนซอร์ส
ด้วยเจตนารมณ์หลักของ TradingView ผู้สร้างสคริปต์นี้ได้ทำให้เป็นโอเพนซอร์ส เพื่อให้เทรดเดอร์สามารถตรวจสอบและยืนยันฟังก์ชันการทำงานของมันได้ ขอชื่นชมผู้เขียน! แม้ว่าคุณจะใช้งานได้ฟรี แต่โปรดจำไว้ว่าการเผยแพร่โค้ดซ้ำจะต้องเป็นไปตาม กฎระเบียบการใช้งาน ของเรา
คำจำกัดสิทธิ์ความรับผิดชอบ
ข้อมูลและบทความไม่ได้มีวัตถุประสงค์เพื่อก่อให้เกิดกิจกรรมทางการเงิน, การลงทุน, การซื้อขาย, ข้อเสนอแนะ หรือคำแนะนำประเภทอื่น ๆ ที่ให้หรือรับรองโดย TradingView อ่านเพิ่มเติมใน ข้อกำหนดการใช้งาน