OPEN-SOURCE SCRIPT
RSI Volume Compression Ribbon
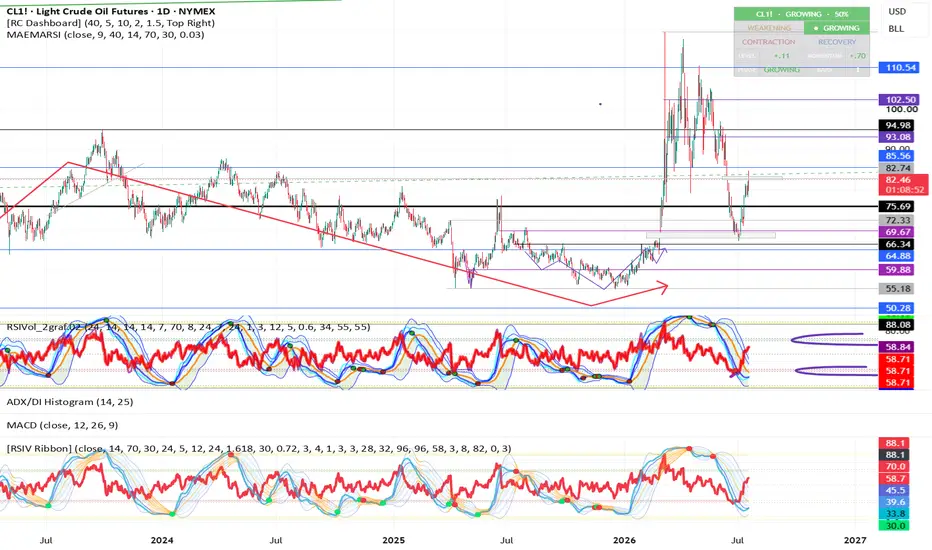
RSI Volume Compression Ribbon
RSI Volume Compression Ribbon combines the standard Price RSI with a volume-weighted RSI momentum model and a multi-band compression ribbon.
The indicator is designed to make momentum contraction and expansion visually clear. Periods in which the ribbon narrows represent reduced momentum volatility and compression. A subsequent widening of the ribbon may indicate the beginning of a stronger directional move.
CORE COMPONENTS
1. Price RSI
The main RSI line is calculated from the selected price source.
It can be used for:
• Overbought and oversold analysis
• Momentum assessment
• Bullish and bearish divergence analysis
• Confirmation of exits from extreme zones
The color, transparency, and thickness of the main RSI line are fully adjustable.
2. Volume-Weighted RSI
The volume component is based on an EMA volume-weighted price:
Volume-Weighted Price =
EMA(Volume × Price) / EMA(Volume)
RSI is then calculated from this volume-weighted price.
Two smoothed Volume RSI lines are displayed:
• Fast Volume RSI — reacts more quickly to changes in volume-weighted momentum
• Slow Volume RSI — represents the broader direction of volume-weighted momentum
When the Fast Volume RSI crosses above the Slow Volume RSI, volume-weighted momentum is strengthening.
When the Fast Volume RSI crosses below the Slow Volume RSI, volume-weighted momentum is weakening.
3. Compression Ribbon
The compression ribbon consists of several volatility envelopes around the Fast Volume RSI.
The bands are calculated using the standard deviation of the Fast Volume RSI.
When the bands contract, the indicator identifies a momentum-compression environment.
When the bands begin to separate after compression, momentum volatility is expanding. This often occurs near the beginning of a stronger market impulse, although the ribbon itself does not determine the direction of the move.
Compression is evaluated relative to the recent average ribbon width, allowing the indicator to adapt to changing market conditions.
4. Crossover Dots
Black-outlined dots mark crossings between the Fast and Slow Volume RSI lines.
By default, the indicator emphasizes crossings that occur:
• During a ribbon compression
• Shortly after compression
• While the ribbon begins to expand
The dot center uses conventional directional colors:
• Green — Fast Volume RSI crosses above Slow Volume RSI
• Red — Fast Volume RSI crosses below Slow Volume RSI
All ordinary crossings can also be displayed through the settings.
Dot size, outline size, and center size are adjustable.
5. Classic RSI Zones
The indicator includes narrow RSI zones inspired by the original concept:
• 70–67: upper momentum zone
• 30–27: lower momentum zone
• 92–89: upper extreme zone
• 8–5: lower extreme zone
The width, colors, and transparency of these zones can be customized.
Optional broad backgrounds for the 0–30 and 70–100 regions are also available.
6. Active Extreme Fills
When the Price RSI moves below the oversold level, the area between the RSI and the oversold boundary is highlighted.
When the Price RSI moves above the overbought level, the corresponding upper area is highlighted.
The colors and transparency of both active fills are independently adjustable.
SIGNALS
The indicator provides alerts for:
• Bullish Volume RSI crossover near compression
• Bearish Volume RSI crossover near compression
• Any Volume RSI crossover near compression
• Price RSI exit from oversold
• Price RSI exit from overbought
Crossover signals are confirmed at bar close.
INTERPRETATION
Compression does not indicate direction by itself.
A compressed ribbon represents reduced momentum dispersion. Direction should be evaluated using:
• The direction of the Fast and Slow Volume RSI crossover
• Price structure
• Support and resistance
• Trend context
• Price RSI behavior
• Divergences
• Volume quality
A common sequence is:
Compression → Volume RSI crossover → Ribbon expansion → Momentum impulse
However, compression may also produce false starts or short-lived expansions, particularly in sideways or illiquid markets.
MARKET APPLICATION
The indicator can be applied to:
• Cryptocurrencies
• Stocks
• Futures
• Commodities
• Currency pairs
• Indices and CFDs with usable volume data
The Volume RSI component is most meaningful when the chart provides reliable volume information. On instruments with synthetic, incomplete, or unavailable volume, the Price RSI may be more reliable than the volume-weighted calculations.
SETTINGS
The indicator includes controls for:
• Price RSI length
• Overbought and oversold levels
• Volume RSI length
• Fast and slow smoothing
• Ribbon calculation length
• Ribbon deviation multiplier
• Compression threshold
• Compression lookback
• Post-compression crossover window
• Main RSI color, transparency, and width
• Zone colors and transparency
• Active fill colors and transparency
• Crossover dot size
• Classic narrow zones
• Broad RSI-zone backgrounds
CREDITS
Original concept and source code:
wozdux — RSIVolume_2graf
This version was redesigned and rewritten in Pine Script v6 with:
• A cleaner visual structure
• Volume RSI compression analysis
• Multi-band compression ribbon
• Compression-filtered crossover dots
• Adjustable visual settings
• Classic RSI zones
• Confirmed crossover alerts
DISCLAIMER
This indicator is provided for informational and educational purposes only. It does not constitute financial or investment advice.
No indicator can predict market direction with certainty. Signals should be evaluated together with market structure, trend context, and appropriate risk management.
RSI Volume Compression Ribbon combines the standard Price RSI with a volume-weighted RSI momentum model and a multi-band compression ribbon.
The indicator is designed to make momentum contraction and expansion visually clear. Periods in which the ribbon narrows represent reduced momentum volatility and compression. A subsequent widening of the ribbon may indicate the beginning of a stronger directional move.
CORE COMPONENTS
1. Price RSI
The main RSI line is calculated from the selected price source.
It can be used for:
• Overbought and oversold analysis
• Momentum assessment
• Bullish and bearish divergence analysis
• Confirmation of exits from extreme zones
The color, transparency, and thickness of the main RSI line are fully adjustable.
2. Volume-Weighted RSI
The volume component is based on an EMA volume-weighted price:
Volume-Weighted Price =
EMA(Volume × Price) / EMA(Volume)
RSI is then calculated from this volume-weighted price.
Two smoothed Volume RSI lines are displayed:
• Fast Volume RSI — reacts more quickly to changes in volume-weighted momentum
• Slow Volume RSI — represents the broader direction of volume-weighted momentum
When the Fast Volume RSI crosses above the Slow Volume RSI, volume-weighted momentum is strengthening.
When the Fast Volume RSI crosses below the Slow Volume RSI, volume-weighted momentum is weakening.
3. Compression Ribbon
The compression ribbon consists of several volatility envelopes around the Fast Volume RSI.
The bands are calculated using the standard deviation of the Fast Volume RSI.
When the bands contract, the indicator identifies a momentum-compression environment.
When the bands begin to separate after compression, momentum volatility is expanding. This often occurs near the beginning of a stronger market impulse, although the ribbon itself does not determine the direction of the move.
Compression is evaluated relative to the recent average ribbon width, allowing the indicator to adapt to changing market conditions.
4. Crossover Dots
Black-outlined dots mark crossings between the Fast and Slow Volume RSI lines.
By default, the indicator emphasizes crossings that occur:
• During a ribbon compression
• Shortly after compression
• While the ribbon begins to expand
The dot center uses conventional directional colors:
• Green — Fast Volume RSI crosses above Slow Volume RSI
• Red — Fast Volume RSI crosses below Slow Volume RSI
All ordinary crossings can also be displayed through the settings.
Dot size, outline size, and center size are adjustable.
5. Classic RSI Zones
The indicator includes narrow RSI zones inspired by the original concept:
• 70–67: upper momentum zone
• 30–27: lower momentum zone
• 92–89: upper extreme zone
• 8–5: lower extreme zone
The width, colors, and transparency of these zones can be customized.
Optional broad backgrounds for the 0–30 and 70–100 regions are also available.
6. Active Extreme Fills
When the Price RSI moves below the oversold level, the area between the RSI and the oversold boundary is highlighted.
When the Price RSI moves above the overbought level, the corresponding upper area is highlighted.
The colors and transparency of both active fills are independently adjustable.
SIGNALS
The indicator provides alerts for:
• Bullish Volume RSI crossover near compression
• Bearish Volume RSI crossover near compression
• Any Volume RSI crossover near compression
• Price RSI exit from oversold
• Price RSI exit from overbought
Crossover signals are confirmed at bar close.
INTERPRETATION
Compression does not indicate direction by itself.
A compressed ribbon represents reduced momentum dispersion. Direction should be evaluated using:
• The direction of the Fast and Slow Volume RSI crossover
• Price structure
• Support and resistance
• Trend context
• Price RSI behavior
• Divergences
• Volume quality
A common sequence is:
Compression → Volume RSI crossover → Ribbon expansion → Momentum impulse
However, compression may also produce false starts or short-lived expansions, particularly in sideways or illiquid markets.
MARKET APPLICATION
The indicator can be applied to:
• Cryptocurrencies
• Stocks
• Futures
• Commodities
• Currency pairs
• Indices and CFDs with usable volume data
The Volume RSI component is most meaningful when the chart provides reliable volume information. On instruments with synthetic, incomplete, or unavailable volume, the Price RSI may be more reliable than the volume-weighted calculations.
SETTINGS
The indicator includes controls for:
• Price RSI length
• Overbought and oversold levels
• Volume RSI length
• Fast and slow smoothing
• Ribbon calculation length
• Ribbon deviation multiplier
• Compression threshold
• Compression lookback
• Post-compression crossover window
• Main RSI color, transparency, and width
• Zone colors and transparency
• Active fill colors and transparency
• Crossover dot size
• Classic narrow zones
• Broad RSI-zone backgrounds
CREDITS
Original concept and source code:
wozdux — RSIVolume_2graf
This version was redesigned and rewritten in Pine Script v6 with:
• A cleaner visual structure
• Volume RSI compression analysis
• Multi-band compression ribbon
• Compression-filtered crossover dots
• Adjustable visual settings
• Classic RSI zones
• Confirmed crossover alerts
DISCLAIMER
This indicator is provided for informational and educational purposes only. It does not constitute financial or investment advice.
No indicator can predict market direction with certainty. Signals should be evaluated together with market structure, trend context, and appropriate risk management.
สคริปต์โอเพนซอร์ซ
ด้วยเจตนารมณ์หลักของ TradingView ผู้สร้างสคริปต์นี้ได้ทำให้เป็นโอเพนซอร์ส เพื่อให้เทรดเดอร์สามารถตรวจสอบและยืนยันฟังก์ชันการทำงานของมันได้ ขอชื่นชมผู้เขียน! แม้ว่าคุณจะใช้งานได้ฟรี แต่โปรดจำไว้ว่าการเผยแพร่โค้ดซ้ำจะต้องเป็นไปตาม กฎระเบียบการใช้งาน ของเรา

คำจำกัดสิทธิ์ความรับผิดชอบ
ข้อมูลและบทความไม่ได้มีวัตถุประสงค์เพื่อก่อให้เกิดกิจกรรมทางการเงิน, การลงทุน, การซื้อขาย, ข้อเสนอแนะ หรือคำแนะนำประเภทอื่น ๆ ที่ให้หรือรับรองโดย TradingView อ่านเพิ่มเติมใน ข้อกำหนดการใช้งาน
สคริปต์โอเพนซอร์ซ
ด้วยเจตนารมณ์หลักของ TradingView ผู้สร้างสคริปต์นี้ได้ทำให้เป็นโอเพนซอร์ส เพื่อให้เทรดเดอร์สามารถตรวจสอบและยืนยันฟังก์ชันการทำงานของมันได้ ขอชื่นชมผู้เขียน! แม้ว่าคุณจะใช้งานได้ฟรี แต่โปรดจำไว้ว่าการเผยแพร่โค้ดซ้ำจะต้องเป็นไปตาม กฎระเบียบการใช้งาน ของเรา
คำจำกัดสิทธิ์ความรับผิดชอบ
ข้อมูลและบทความไม่ได้มีวัตถุประสงค์เพื่อก่อให้เกิดกิจกรรมทางการเงิน, การลงทุน, การซื้อขาย, ข้อเสนอแนะ หรือคำแนะนำประเภทอื่น ๆ ที่ให้หรือรับรองโดย TradingView อ่านเพิ่มเติมใน ข้อกำหนดการใช้งาน