OPEN-SOURCE SCRIPT
Sonic R (13-34-89) by DQT
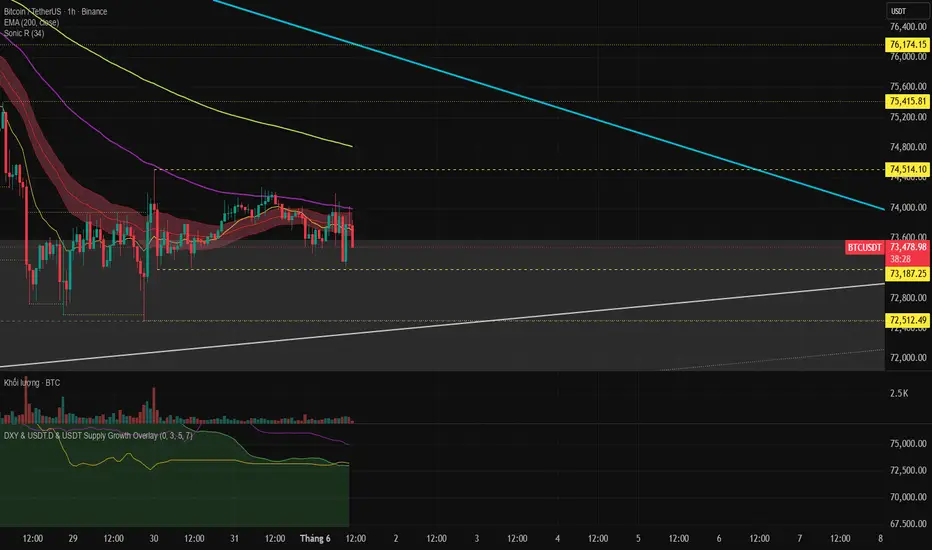
Sonic R System - EMA 13-34-89-200
Description:
The Sonic R indicator is built upon a multi-layered Exponential Moving Average (EMA) system combined with a Price Action Channel (PAC), designed to identify market trends, dynamic support/resistance zones, and high-probability trade entries.
Core Components:
1. Price Action Channel (PAC) — EMA 34 Band
The PAC is calculated using EMA 34 applied to High, Low, and Close prices, forming a dynamic channel that represents the short-term equilibrium zone. Price above the channel signals bullish momentum; price below signals bearish pressure.
2. EMA Trend System:
🟡 EMA 13 — Fast-reacting short-term trend, captures immediate price momentum
🔴 EMA 34 — Core support/resistance zone displayed as a red band, acts as the market's heartbeat
🟣 EMA 89 — Medium-term trend filter, smooths out market noise
🟢 EMA 200 — Long-term trend anchor, defines the overall market direction
How to Use:
Price above all EMAs → strong uptrend, prioritize buy setups
Price below all EMAs → strong downtrend, prioritize sell setups
Price inside the red EMA 34 band → market consolidating, wait for breakout confirmation
EMAs stacked in order (13 > 34 > 89 > 200) → trend is clean and strong, highest confidence entries
Best Used On: All timeframes — most effective on H1, H4, and Daily charts.
Description:
The Sonic R indicator is built upon a multi-layered Exponential Moving Average (EMA) system combined with a Price Action Channel (PAC), designed to identify market trends, dynamic support/resistance zones, and high-probability trade entries.
Core Components:
1. Price Action Channel (PAC) — EMA 34 Band
The PAC is calculated using EMA 34 applied to High, Low, and Close prices, forming a dynamic channel that represents the short-term equilibrium zone. Price above the channel signals bullish momentum; price below signals bearish pressure.
2. EMA Trend System:
🟡 EMA 13 — Fast-reacting short-term trend, captures immediate price momentum
🔴 EMA 34 — Core support/resistance zone displayed as a red band, acts as the market's heartbeat
🟣 EMA 89 — Medium-term trend filter, smooths out market noise
🟢 EMA 200 — Long-term trend anchor, defines the overall market direction
How to Use:
Price above all EMAs → strong uptrend, prioritize buy setups
Price below all EMAs → strong downtrend, prioritize sell setups
Price inside the red EMA 34 band → market consolidating, wait for breakout confirmation
EMAs stacked in order (13 > 34 > 89 > 200) → trend is clean and strong, highest confidence entries
Best Used On: All timeframes — most effective on H1, H4, and Daily charts.
สคริปต์แบบโอเพนซอร์ส
ด้วยเจตนารมณ์หลักของ TradingView ผู้สร้างสคริปต์นี้ได้ทำให้เป็นโอเพนซอร์ส เพื่อให้เทรดเดอร์สามารถตรวจสอบและยืนยันฟังก์ชันการทำงานของมันได้ ขอชื่นชมผู้เขียน! แม้ว่าคุณจะใช้งานได้ฟรี แต่โปรดจำไว้ว่าการเผยแพร่โค้ดซ้ำจะต้องเป็นไปตาม กฎระเบียบการใช้งาน ของเรา

คำจำกัดสิทธิ์ความรับผิดชอบ
ข้อมูลและบทความไม่ได้มีวัตถุประสงค์เพื่อก่อให้เกิดกิจกรรมทางการเงิน, การลงทุน, การซื้อขาย, ข้อเสนอแนะ หรือคำแนะนำประเภทอื่น ๆ ที่ให้หรือรับรองโดย TradingView อ่านเพิ่มเติมใน ข้อกำหนดการใช้งาน
สคริปต์แบบโอเพนซอร์ส
ด้วยเจตนารมณ์หลักของ TradingView ผู้สร้างสคริปต์นี้ได้ทำให้เป็นโอเพนซอร์ส เพื่อให้เทรดเดอร์สามารถตรวจสอบและยืนยันฟังก์ชันการทำงานของมันได้ ขอชื่นชมผู้เขียน! แม้ว่าคุณจะใช้งานได้ฟรี แต่โปรดจำไว้ว่าการเผยแพร่โค้ดซ้ำจะต้องเป็นไปตาม กฎระเบียบการใช้งาน ของเรา
คำจำกัดสิทธิ์ความรับผิดชอบ
ข้อมูลและบทความไม่ได้มีวัตถุประสงค์เพื่อก่อให้เกิดกิจกรรมทางการเงิน, การลงทุน, การซื้อขาย, ข้อเสนอแนะ หรือคำแนะนำประเภทอื่น ๆ ที่ให้หรือรับรองโดย TradingView อ่านเพิ่มเติมใน ข้อกำหนดการใช้งาน