FrenchFinance_Funding v0.1
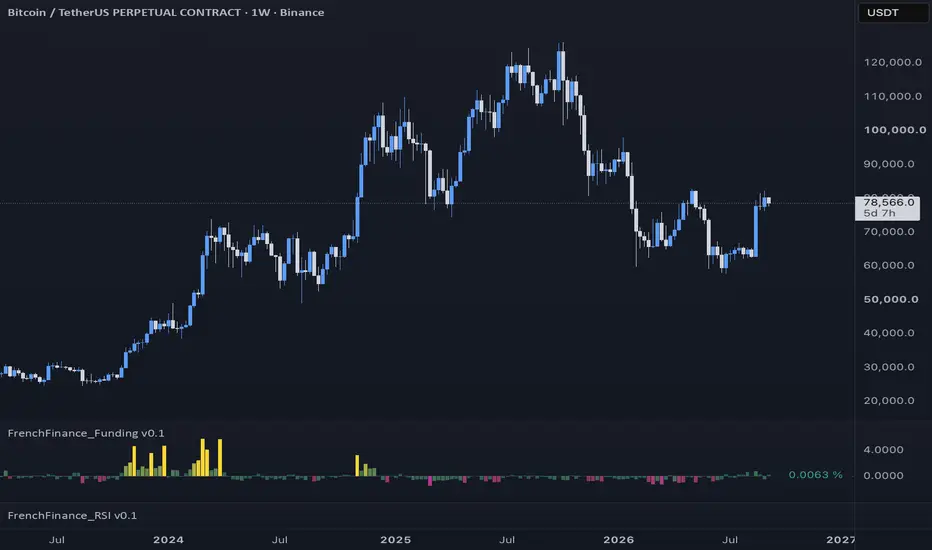
Shows the perpetual funding rate of the charted coin, averaged across Binance, Bybit and OKX USDT perpetuals, as coloured columns. It is a display tool: it tells you who is paying to hold a position and how unusual that is. It gives no buy or sell signal.
HOW IT WORKS
• The coin is detected from the chart's base currency (BTC, ETH…). The funding rate of its USDT perpetual is requested on each selected venue through TradingView's crypto derivatives data (the same "Funding Rate" metric as TradingView's built-in indicators) and averaged with equal weights; venues without that perpetual are skipped. On a stock, index or forex chart nothing is shown, unless you set a coin manually.
• Column height: z-score of the funding over the last 100 bars (default), or the raw funding in %.
• Colour: green when longs pay, red when shorts pay. The further the value is from its recent norm, the brighter the colour.
• Label on the last bar: current funding in %, or "Funding not available on this pair".
SETTINGS
• Extremes: z-score threshold (default 1.5 over 100 bars) or absolute thresholds in %.
• Venues can be switched on and off. Bar height, clipping, data scale and colours are adjustable.
ALERTS
Two alerts: funding extremely positive (longs pay) and funding extremely negative (shorts pay). They report a state, not a trade.
NOTES
• The last bar shows the predicted funding, which keeps updating until settlement; closed bars do not change.
• Built with the open-source TradingView "Request" library (cryptoDerivativeMetric). Funding is information about positioning, not a forecast.
HOW IT WORKS
• The coin is detected from the chart's base currency (BTC, ETH…). The funding rate of its USDT perpetual is requested on each selected venue through TradingView's crypto derivatives data (the same "Funding Rate" metric as TradingView's built-in indicators) and averaged with equal weights; venues without that perpetual are skipped. On a stock, index or forex chart nothing is shown, unless you set a coin manually.
• Column height: z-score of the funding over the last 100 bars (default), or the raw funding in %.
• Colour: green when longs pay, red when shorts pay. The further the value is from its recent norm, the brighter the colour.
• Label on the last bar: current funding in %, or "Funding not available on this pair".
SETTINGS
• Extremes: z-score threshold (default 1.5 over 100 bars) or absolute thresholds in %.
• Venues can be switched on and off. Bar height, clipping, data scale and colours are adjustable.
ALERTS
Two alerts: funding extremely positive (longs pay) and funding extremely negative (shorts pay). They report a state, not a trade.
NOTES
• The last bar shows the predicted funding, which keeps updating until settlement; closed bars do not change.
• Built with the open-source TradingView "Request" library (cryptoDerivativeMetric). Funding is information about positioning, not a forecast.

คำจำกัดสิทธิ์ความรับผิดชอบ
ข้อมูลและบทความไม่ได้มีวัตถุประสงค์เพื่อก่อให้เกิดกิจกรรมทางการเงิน, การลงทุน, การซื้อขาย, ข้อเสนอแนะ หรือคำแนะนำประเภทอื่น ๆ ที่ให้หรือรับรองโดย TradingView อ่านเพิ่มเติมใน ข้อกำหนดการใช้งาน
คำจำกัดสิทธิ์ความรับผิดชอบ
ข้อมูลและบทความไม่ได้มีวัตถุประสงค์เพื่อก่อให้เกิดกิจกรรมทางการเงิน, การลงทุน, การซื้อขาย, ข้อเสนอแนะ หรือคำแนะนำประเภทอื่น ๆ ที่ให้หรือรับรองโดย TradingView อ่านเพิ่มเติมใน ข้อกำหนดการใช้งาน