OPEN-SOURCE SCRIPT
Adaptive Squeeze Breakout [NQ Labs]
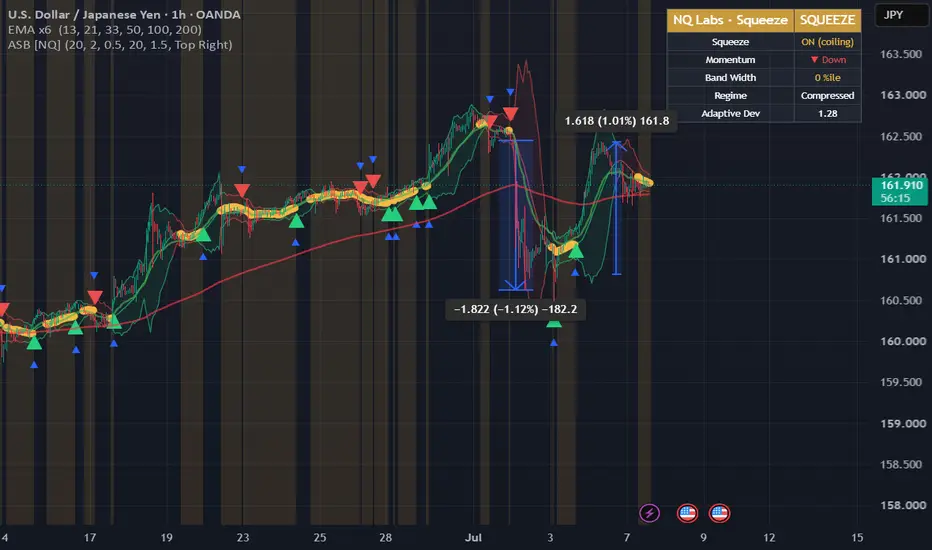
Adaptive Squeeze Breakout [NQ Labs]
The Adaptive Squeeze Breakout combines two concepts into a single volatility-timing tool: adaptive Bollinger Bands that adjust to the current volatility regime, and a squeeze-to-breakout system that identifies volatility compression before expansion.
The Two Core Ideas:
1. Adaptive Bollinger Bands
Standard Bollinger Bands use a fixed deviation multiplier, which means they treat trending and choppy conditions identically. This version adjusts the deviation using a Kaufman-style efficiency ratio — a measure of how directional recent price movement has been relative to its total path.
When price is moving efficiently (trending), the bands widen to give the move room. When price is chopping back and forth (low efficiency), the bands tighten. The result is a band that breathes with the market's character rather than applying one setting everywhere. The Adaptive Strength input controls how much this effect is applied, from fully fixed (0) to fully adaptive (1).
2. Squeeze-to-Breakout
A "squeeze" occurs when volatility compresses — often preceding a larger move. This is detected by measuring when the adaptive Bollinger Bands contract inside the Keltner Channels. While the bands sit inside the Keltner range, the market is coiling. When they expand back outside, the squeeze releases, and the tool flags the breakout in the direction of momentum.
How It Works On The Chart:
▢ Adaptive Bands — The Bollinger Bands, colored by momentum direction, with the deviation adjusting to volatility efficiency.
▢ Squeeze Highlight — An amber background and marker dots appear while the market is in a squeeze (bands compressed inside the Keltner Channels), giving an at-a-glance view of coiling conditions.
▢ Breakout Signals — A triangle marks the bar where a squeeze releases, pointing in the direction of momentum at that moment.
▢ Dashboard — A panel showing the current squeeze state, momentum direction, bandwidth percentile (where current volatility sits historically), volatility regime (compressed / normal / expanded), and the live adaptive deviation value.
Settings:
All components are adjustable: Bollinger length and base deviation, adaptive strength, Keltner length and ATR multiplier, and full control over visuals, colors, and the dashboard position. Alerts are available for breakouts (up and down) and for the start of a squeeze.
How Traders Might Use It:
The squeeze highlights conditions of volatility compression, which some traders use as a preparation signal — a period to watch for an impending expansion rather than to trade the range itself. The breakout marker then indicates the direction in which the compression resolved. As with any volatility tool, squeezes can release in either direction and can produce false starts, so many traders combine this with a trend or structure filter rather than trading breakouts in isolation.
Notes:
This indicator visualizes volatility conditions and breakout timing. It does not predict direction with certainty and makes no claim about future performance. It is intended as one component within a broader analysis process. Results vary across markets, timeframes, and conditions — test thoroughly before relying on it.
Open-source and free to use.
Feedback and suggestions are welcome.
สคริปต์โอเพนซอร์ซ
ด้วยเจตนารมณ์หลักของ TradingView ผู้สร้างสคริปต์นี้ได้ทำให้เป็นโอเพนซอร์ส เพื่อให้เทรดเดอร์สามารถตรวจสอบและยืนยันฟังก์ชันการทำงานของมันได้ ขอชื่นชมผู้เขียน! แม้ว่าคุณจะใช้งานได้ฟรี แต่โปรดจำไว้ว่าการเผยแพร่โค้ดซ้ำจะต้องเป็นไปตาม กฎระเบียบการใช้งาน ของเรา

คำจำกัดสิทธิ์ความรับผิดชอบ
ข้อมูลและบทความไม่ได้มีวัตถุประสงค์เพื่อก่อให้เกิดกิจกรรมทางการเงิน, การลงทุน, การซื้อขาย, ข้อเสนอแนะ หรือคำแนะนำประเภทอื่น ๆ ที่ให้หรือรับรองโดย TradingView อ่านเพิ่มเติมใน ข้อกำหนดการใช้งาน
สคริปต์โอเพนซอร์ซ
ด้วยเจตนารมณ์หลักของ TradingView ผู้สร้างสคริปต์นี้ได้ทำให้เป็นโอเพนซอร์ส เพื่อให้เทรดเดอร์สามารถตรวจสอบและยืนยันฟังก์ชันการทำงานของมันได้ ขอชื่นชมผู้เขียน! แม้ว่าคุณจะใช้งานได้ฟรี แต่โปรดจำไว้ว่าการเผยแพร่โค้ดซ้ำจะต้องเป็นไปตาม กฎระเบียบการใช้งาน ของเรา
คำจำกัดสิทธิ์ความรับผิดชอบ
ข้อมูลและบทความไม่ได้มีวัตถุประสงค์เพื่อก่อให้เกิดกิจกรรมทางการเงิน, การลงทุน, การซื้อขาย, ข้อเสนอแนะ หรือคำแนะนำประเภทอื่น ๆ ที่ให้หรือรับรองโดย TradingView อ่านเพิ่มเติมใน ข้อกำหนดการใช้งาน