OPEN-SOURCE SCRIPT
GFG MTF Candle with table by Agaam
## GFG MTF Candle with table by Agaam
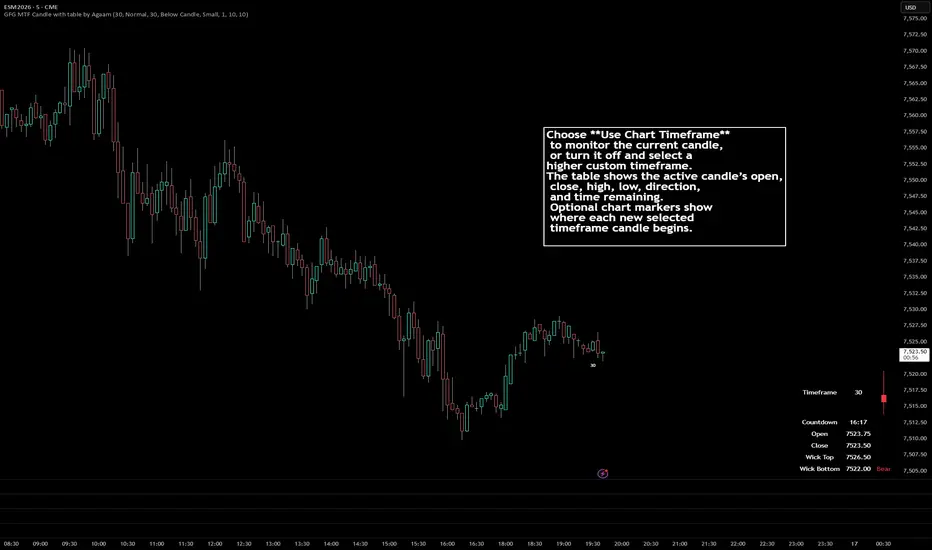
GFG MTF Candle with table by Agaam is a multi-timeframe candle-monitoring indicator that displays the active candle’s price information in a compact table while allowing the user to remain on a different chart timeframe.
The indicator can follow either the current chart candle or a selected higher-timeframe candle. It also includes optional chart markers that identify where each new selected timeframe candle begins.
### Information displayed in the table
The table shows:
* Selected candle timeframe
* Time remaining until the candle closes
* Candle opening price
* Current closing price
* Current candle high
* Current candle low
* Bull, Bear, or Doji status
* A compact visual representation of the candle body and wicks
“Wick Top” represents the candle’s current highest price.
“Wick Bottom” represents the candle’s current lowest price.
All price values use the symbol’s minimum tick formatting.
### Candle direction
The active candle is classified as:
* **Bull** when the current close is above the open
* **Bear** when the current close is below the open
* **Doji** when the current close equals the open
Bullish, bearish, and doji colors can be customized separately.
### Miniature candle display
The third table column contains a simplified text-based representation of the selected candle.
The visual uses:
* Solid blocks to represent the area between the open and close
* Vertical lines to represent the upper and lower wick areas
* The current Bull, Bear, or Doji color
This display is intended as a quick visual reference. It is an approximation and is not a full replacement for a standard candlestick.
### Timeframe modes
The indicator includes two operating modes.
#### Use Chart Timeframe
When enabled, the table follows the active candle on the current chart.
For example, when applied to a 5-minute chart, the table displays the current 5-minute candle.
#### Custom Timeframe
When “Use Chart Timeframe” is disabled, the table follows the selected custom timeframe.
For example:
* Chart timeframe: 1 minute
* Custom table timeframe: 15 minutes
The table will display the developing 15-minute candle while the user continues viewing the 1-minute chart.
The custom table timeframe should be equal to or higher than the chart timeframe.
### Candle countdown
The countdown displays the estimated time remaining before the selected candle closes.
Depending on the remaining duration, the timer is displayed as:
* Minutes and seconds
* Hours, minutes, and seconds
Examples:
* `4:32`
* `1:14:08`
When a valid candle-closing timestamp is unavailable, the countdown may display `--:--`.
Countdown availability can depend on the symbol, chart type, trading session, and data supplied by TradingView.
### Higher-timeframe candle markers
Optional markers can be displayed on the price chart whenever a new candle begins on the selected marker timeframe.
Examples include:
* `5` for a 5-minute candle
* `30` for a 30-minute candle
* `60` for a 60-minute candle
* `1D` for a daily candle
* `1W` for a weekly candle
* `1M` for a monthly candle
The marker identifies the first chart bar belonging to the new selected timeframe candle.
It does not represent a trading signal or show the opening-price value.
### Marker settings
Users can control:
* Whether markers are displayed
* Marker timeframe
* Marker position above or below the candle
* Marker text color
* Marker text size
* Distance from the candle in ticks
* Maximum number of markers retained on the chart
When the selected marker limit is exceeded, the oldest marker is removed first.
The marker timeframe should be equal to or higher than the chart timeframe.
### Table customization
The table can be customized through the indicator settings.
Available options include:
* Show or hide the table
* Use chart or custom timeframe
* Table text size
* Bull candle color
* Bear candle color
* Doji candle color
* Table background color
* Table text color
* Transparent table background
### Live candle behavior
The table monitors the currently developing candle.
While that candle remains open, the following values may continue changing:
* High
* Low
* Close
* Bull, Bear, or Doji status
* Miniature candle shape
* Remaining time
The opening price remains fixed after the candle begins.
Once the candle closes, its final OHLC values are complete, and the table begins monitoring the next active candle.
### Repainting information
The indicator does not intentionally use future-bar information or lookahead calculations.
However, the active candle is unfinished. Its high, low, close, direction, and candle appearance naturally update as new price data becomes available.
When a higher timeframe is selected, its values continue developing until that higher-timeframe candle closes.
This is normal live-candle behavior and should not be interpreted as a confirmed signal before the selected candle has closed.
### Suggested uses
The indicator may help with:
* Monitoring a higher-timeframe candle from a lower-timeframe chart
* Comparing the current price with the higher-timeframe open
* Tracking the developing candle high and low
* Observing whether the active candle is bullish, bearish, or neutral
* Monitoring time remaining before candle close
* Identifying where new higher-timeframe candles begin
* Supporting multi-timeframe price-action analysis
Example setup:
* Chart timeframe: 5 minutes
* Table timeframe: 30 minutes
* Marker timeframe: 30 minutes
This setup allows the user to view 5-minute price action while monitoring the developing 30-minute candle.
### Limitations
This indicator does not:
* Generate automatic buy or sell signals
* Predict future market direction
* Measure order flow
* Calculate bid-and-ask delta
* Determine institutional activity
* Provide stop-loss or take-profit levels
* Execute trades
* Backtest a trading strategy
The miniature candle display is a simplified representation and may not reproduce every proportional detail of a standard candlestick.
### Disclaimer
This indicator is intended for informational and educational purposes only.
It is not financial, investment, or trading advice. It does not guarantee profitable results or predict future price movements. Trading involves risk, including the potential loss of capital.
Users should perform their own analysis and apply appropriate risk-management practices before making trading decisions.
GFG MTF Candle with table by Agaam is a multi-timeframe candle-monitoring indicator that displays the active candle’s price information in a compact table while allowing the user to remain on a different chart timeframe.
The indicator can follow either the current chart candle or a selected higher-timeframe candle. It also includes optional chart markers that identify where each new selected timeframe candle begins.
### Information displayed in the table
The table shows:
* Selected candle timeframe
* Time remaining until the candle closes
* Candle opening price
* Current closing price
* Current candle high
* Current candle low
* Bull, Bear, or Doji status
* A compact visual representation of the candle body and wicks
“Wick Top” represents the candle’s current highest price.
“Wick Bottom” represents the candle’s current lowest price.
All price values use the symbol’s minimum tick formatting.
### Candle direction
The active candle is classified as:
* **Bull** when the current close is above the open
* **Bear** when the current close is below the open
* **Doji** when the current close equals the open
Bullish, bearish, and doji colors can be customized separately.
### Miniature candle display
The third table column contains a simplified text-based representation of the selected candle.
The visual uses:
* Solid blocks to represent the area between the open and close
* Vertical lines to represent the upper and lower wick areas
* The current Bull, Bear, or Doji color
This display is intended as a quick visual reference. It is an approximation and is not a full replacement for a standard candlestick.
### Timeframe modes
The indicator includes two operating modes.
#### Use Chart Timeframe
When enabled, the table follows the active candle on the current chart.
For example, when applied to a 5-minute chart, the table displays the current 5-minute candle.
#### Custom Timeframe
When “Use Chart Timeframe” is disabled, the table follows the selected custom timeframe.
For example:
* Chart timeframe: 1 minute
* Custom table timeframe: 15 minutes
The table will display the developing 15-minute candle while the user continues viewing the 1-minute chart.
The custom table timeframe should be equal to or higher than the chart timeframe.
### Candle countdown
The countdown displays the estimated time remaining before the selected candle closes.
Depending on the remaining duration, the timer is displayed as:
* Minutes and seconds
* Hours, minutes, and seconds
Examples:
* `4:32`
* `1:14:08`
When a valid candle-closing timestamp is unavailable, the countdown may display `--:--`.
Countdown availability can depend on the symbol, chart type, trading session, and data supplied by TradingView.
### Higher-timeframe candle markers
Optional markers can be displayed on the price chart whenever a new candle begins on the selected marker timeframe.
Examples include:
* `5` for a 5-minute candle
* `30` for a 30-minute candle
* `60` for a 60-minute candle
* `1D` for a daily candle
* `1W` for a weekly candle
* `1M` for a monthly candle
The marker identifies the first chart bar belonging to the new selected timeframe candle.
It does not represent a trading signal or show the opening-price value.
### Marker settings
Users can control:
* Whether markers are displayed
* Marker timeframe
* Marker position above or below the candle
* Marker text color
* Marker text size
* Distance from the candle in ticks
* Maximum number of markers retained on the chart
When the selected marker limit is exceeded, the oldest marker is removed first.
The marker timeframe should be equal to or higher than the chart timeframe.
### Table customization
The table can be customized through the indicator settings.
Available options include:
* Show or hide the table
* Use chart or custom timeframe
* Table text size
* Bull candle color
* Bear candle color
* Doji candle color
* Table background color
* Table text color
* Transparent table background
### Live candle behavior
The table monitors the currently developing candle.
While that candle remains open, the following values may continue changing:
* High
* Low
* Close
* Bull, Bear, or Doji status
* Miniature candle shape
* Remaining time
The opening price remains fixed after the candle begins.
Once the candle closes, its final OHLC values are complete, and the table begins monitoring the next active candle.
### Repainting information
The indicator does not intentionally use future-bar information or lookahead calculations.
However, the active candle is unfinished. Its high, low, close, direction, and candle appearance naturally update as new price data becomes available.
When a higher timeframe is selected, its values continue developing until that higher-timeframe candle closes.
This is normal live-candle behavior and should not be interpreted as a confirmed signal before the selected candle has closed.
### Suggested uses
The indicator may help with:
* Monitoring a higher-timeframe candle from a lower-timeframe chart
* Comparing the current price with the higher-timeframe open
* Tracking the developing candle high and low
* Observing whether the active candle is bullish, bearish, or neutral
* Monitoring time remaining before candle close
* Identifying where new higher-timeframe candles begin
* Supporting multi-timeframe price-action analysis
Example setup:
* Chart timeframe: 5 minutes
* Table timeframe: 30 minutes
* Marker timeframe: 30 minutes
This setup allows the user to view 5-minute price action while monitoring the developing 30-minute candle.
### Limitations
This indicator does not:
* Generate automatic buy or sell signals
* Predict future market direction
* Measure order flow
* Calculate bid-and-ask delta
* Determine institutional activity
* Provide stop-loss or take-profit levels
* Execute trades
* Backtest a trading strategy
The miniature candle display is a simplified representation and may not reproduce every proportional detail of a standard candlestick.
### Disclaimer
This indicator is intended for informational and educational purposes only.
It is not financial, investment, or trading advice. It does not guarantee profitable results or predict future price movements. Trading involves risk, including the potential loss of capital.
Users should perform their own analysis and apply appropriate risk-management practices before making trading decisions.
สคริปต์โอเพนซอร์ซ
ด้วยเจตนารมณ์หลักของ TradingView ผู้สร้างสคริปต์นี้ได้ทำให้เป็นโอเพนซอร์ส เพื่อให้เทรดเดอร์สามารถตรวจสอบและยืนยันฟังก์ชันการทำงานของมันได้ ขอชื่นชมผู้เขียน! แม้ว่าคุณจะใช้งานได้ฟรี แต่โปรดจำไว้ว่าการเผยแพร่โค้ดซ้ำจะต้องเป็นไปตาม กฎระเบียบการใช้งาน ของเรา

คำจำกัดสิทธิ์ความรับผิดชอบ
ข้อมูลและบทความไม่ได้มีวัตถุประสงค์เพื่อก่อให้เกิดกิจกรรมทางการเงิน, การลงทุน, การซื้อขาย, ข้อเสนอแนะ หรือคำแนะนำประเภทอื่น ๆ ที่ให้หรือรับรองโดย TradingView อ่านเพิ่มเติมใน ข้อกำหนดการใช้งาน
สคริปต์โอเพนซอร์ซ
ด้วยเจตนารมณ์หลักของ TradingView ผู้สร้างสคริปต์นี้ได้ทำให้เป็นโอเพนซอร์ส เพื่อให้เทรดเดอร์สามารถตรวจสอบและยืนยันฟังก์ชันการทำงานของมันได้ ขอชื่นชมผู้เขียน! แม้ว่าคุณจะใช้งานได้ฟรี แต่โปรดจำไว้ว่าการเผยแพร่โค้ดซ้ำจะต้องเป็นไปตาม กฎระเบียบการใช้งาน ของเรา
คำจำกัดสิทธิ์ความรับผิดชอบ
ข้อมูลและบทความไม่ได้มีวัตถุประสงค์เพื่อก่อให้เกิดกิจกรรมทางการเงิน, การลงทุน, การซื้อขาย, ข้อเสนอแนะ หรือคำแนะนำประเภทอื่น ๆ ที่ให้หรือรับรองโดย TradingView อ่านเพิ่มเติมใน ข้อกำหนดการใช้งาน