ที่อัปเดต:
Trend Grading Dashboard V1.0
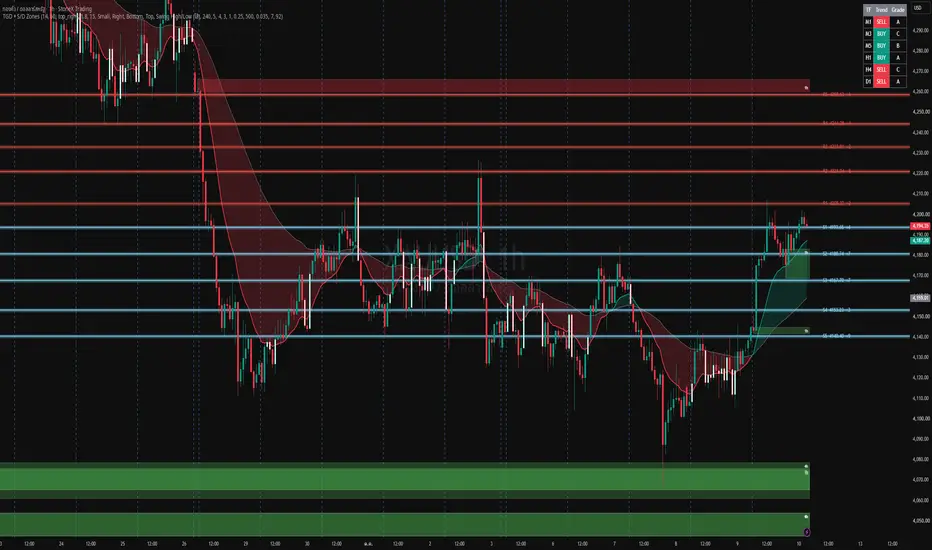
Trend Grading Dashboard By Piyacham
Logic Overview:
Trend Determination:
BUY: EMA14 is above EMA60.
SELL: EMA14 is below EMA60.
Grading System:
Grade A: The trend is strong; price is trading "beyond" the fast EMA (Above EMA14 for BUY, Below EMA14 for SELL).
Grade B: The price is in a retracement zone between the two EMAs.
Grade C: The price has crossed below the slow EMA (for BUY) or above it (for SELL), suggesting a potential trend weakness or reversal.
Timeframes: The dashboard automatically tracks M1, M3, M5, H1, and H4 regardless of your current chart timeframe.
Key Features:
Configurable EMAs: You can change the lengths of both EMAs in the settings.
Customizable Dashboard: You can move the dashboard to any corner of the chart and adjust colors for the text and headers.
Visual Clarity: The dashboard cells are color-coded based on the trend (Green for BUY, Red for SELL) for quick scanning.
Logic Overview:
Trend Determination:
BUY: EMA14 is above EMA60.
SELL: EMA14 is below EMA60.
Grading System:
Grade A: The trend is strong; price is trading "beyond" the fast EMA (Above EMA14 for BUY, Below EMA14 for SELL).
Grade B: The price is in a retracement zone between the two EMAs.
Grade C: The price has crossed below the slow EMA (for BUY) or above it (for SELL), suggesting a potential trend weakness or reversal.
Timeframes: The dashboard automatically tracks M1, M3, M5, H1, and H4 regardless of your current chart timeframe.
Key Features:
Configurable EMAs: You can change the lengths of both EMAs in the settings.
Customizable Dashboard: You can move the dashboard to any corner of the chart and adjust colors for the text and headers.
Visual Clarity: The dashboard cells are color-coded based on the trend (Green for BUY, Red for SELL) for quick scanning.
Release Note
The upgrade version of Trend Grading Dashboard V1.0This version add this following features
+ Add grading of TF Day in to dashboard and also
+ add alert feature
- Signal BUY : Present when the candle stick of specific timeframe shift momentum from SELL to BUY
- Signal SELL : Present when the candle stick of specific timeframe shift momentum from BUY to SELL
Release Note
Add Toggle Enable/Disable Signal Buy/Sell to chartRelease Note
Add Multi Time frame Supply and Demand Zone Release Note
Update – Support & Resistance (H4 Pair Touches)New: Support & Resistance levels
Optional feature – can be turned off at any time with the “Show Support / Resistance” toggle. When turned off, the indicator works exactly as before.
Horizontal levels built from “pair touches”: the price where two adjacent opposite-color candle bodies meet (close of the first candle / open of the next).
Touches are collected from the H4 timeframe by default (adjustable), and nearby touches are clustered into one level.
Shows the nearest 5 resistance levels above price (red, R1–R5) and 5 support levels below price (light blue, S1–S5). Levels update as price moves.
Each level is labeled with its price and touch count, e.g. R1 4182.62 ×11. Levels with many touches are drawn thicker.
Soft glow around each line (7 layers by default) to mark the level as a zone. The glow can also be turned off separately, keeping only the lines.
Settings (new group “Support / Resistance”)
Show / hide Support & Resistance (on by default)
Timeframe used to find touches (default H4)
Number of levels per side (default 5)
Minimum touches per level (default 4)
Clustering distance (× ATR14 of the selected timeframe)
Colors, glow on/off, glow thickness, layers and transparency
Notes
Works best when the chart timeframe is equal to or lower than the touch timeframe.
Touches are counted from the chart’s loaded history, so very low timeframes with short history may show fewer levels.
Optimized for Bar Replay (no memory-limit errors).Update – Support & Resistance (H4 Pair Touches)
New: Support & Resistance levels
Horizontal levels built from “pair touches”: the price where two adjacent opposite-color candle bodies meet (close of the first candle / open of the next).
Touches are collected from the H4 timeframe by default (adjustable), and nearby touches are clustered into one level.
Shows the nearest 5 resistance levels above price (red, R1–R5) and 5 support levels below price (light blue, S1–S5). Levels update as price moves.
Each level is labeled with its price and touch count, e.g. R1 4182.62 ×11. Levels with many touches are drawn thicker.
Soft glow around each line (7 layers by default) to mark the level as a zone. Thickness, layers and transparency are adjustable.
Settings (new group “Support / Resistance”)
Timeframe used to find touches (default H4)
Number of levels per side (default 5)
Minimum touches per level (default 4)
Clustering distance (× ATR14 of the selected timeframe)
Colors, glow on/off, glow thickness, layers and transparency
Notes
Works best when the chart timeframe is equal to or lower than the touch timeframe.
Touches are counted from the chart’s loaded history, so very low timeframes with short history may show fewer levels.
Optimized for Bar Replay (no memory-limit errors).
Release Note
Update – Support & ResistanceNew: Horizontal Support & Resistance levels (nearest 5 above and 5 below price), labeled with price and touch count, with a soft glow around each line.
Two methods to choose from:
Swing High/Low – levels from swing highs and lows (default)
Body Pair Touches – where two adjacent opposite-color candle bodies meet
Uses H4 by default (adjustable).
Optional – can be turned off anytime; the dashboard, EMAs and Supply/Demand zones work as before.
Optimized for Bar Replay.

คำจำกัดสิทธิ์ความรับผิดชอบ
ข้อมูลและบทความไม่ได้มีวัตถุประสงค์เพื่อก่อให้เกิดกิจกรรมทางการเงิน, การลงทุน, การซื้อขาย, ข้อเสนอแนะ หรือคำแนะนำประเภทอื่น ๆ ที่ให้หรือรับรองโดย TradingView อ่านเพิ่มเติมใน ข้อกำหนดการใช้งาน
คำจำกัดสิทธิ์ความรับผิดชอบ
ข้อมูลและบทความไม่ได้มีวัตถุประสงค์เพื่อก่อให้เกิดกิจกรรมทางการเงิน, การลงทุน, การซื้อขาย, ข้อเสนอแนะ หรือคำแนะนำประเภทอื่น ๆ ที่ให้หรือรับรองโดย TradingView อ่านเพิ่มเติมใน ข้อกำหนดการใช้งาน