OPEN-SOURCE SCRIPT
ที่อัปเดต: Auto Trendline Break Quality [AGPro Series]
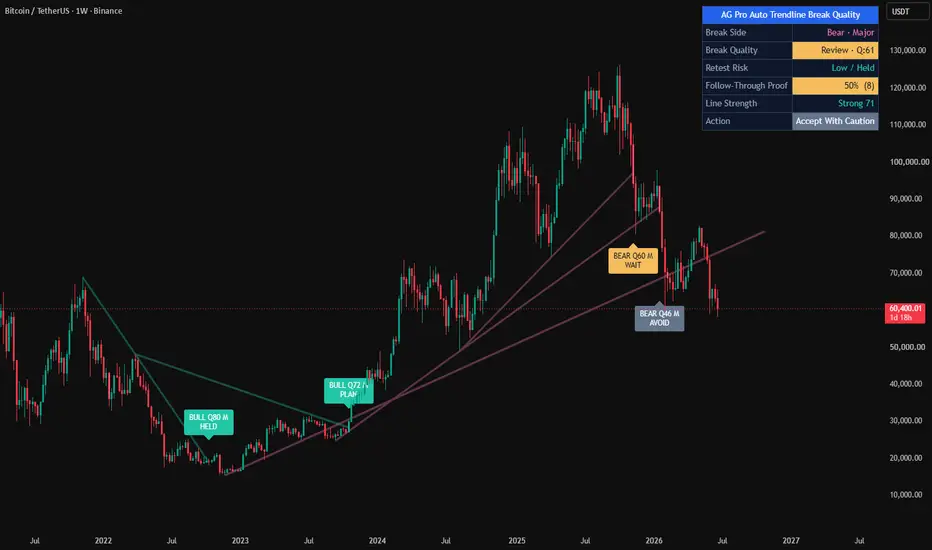
Auto Trendline Break Quality [AGPro Series]
🔹 OVERVIEW
Auto Trendline Break Quality is a structural break-quality engine. It automatically detects bullish and bearish trendlines from swing pivots, monitors every break event in real time, and assigns each break a 0–100 quality score derived from four independent quantitative factors. The tool separates Major (structural) and Minor (tactical) trendlines, so the same break can be evaluated against multiple layers of market structure at once.
The script is purpose-built to answer the single most practical question a price-action trader faces at a trendline break: "Is this break real, or is it a fake-out?"
🧭 UNIQUE EDGE
Most trendline scripts either draw trendlines or flag a break. They stop there. This indicator continues where they stop — and measures the break.
Key differentiators:
• Four-factor composite quality score (Volume · Slope · Impulse · Retest) calibrated to ATR, so the scoring is consistent across assets and timeframes.
• Major/Minor trendline hierarchy. A Major structural break automatically earns a score bonus and is visually flagged with a "MAJ" tag, so structural breaks are never confused with noise breaks.
• State-based visual language. Active trendlines render in a neutral tone. On break, the trendline transitions to the break-direction color (bullish break = bull color, bearish break = bear color), so the chart communicates state without ambiguity.
• Retest logic built directly into the score. A break that is retested and holds within the defined window receives an upgrade; a failed retest downgrades the score. The chart label reflects the final, updated quality.
• Optional zone-band rendering around Major trendlines, letting the user see each structural line as a reaction zone rather than a bare line.
• Label confluence grouping to prevent chart clutter when multiple breaks occur near the same price level.
⚙️ METHODOLOGY
1) Trendline detection
Pivots are identified using standard pivot-high and pivot-low logic with two configurable lookbacks — one for Major trendlines and one for Minor. A new trendline is validated between the two most recent same-side pivots when the slope (ATR-normalized) exceeds the minimum threshold. Nearly-flat trendlines are rejected by design.
2) Break detection
A trendline is considered broken when the current candle closes on the opposite side of the projected line while the previous candle closed on the valid side. This one-bar confirmation rule avoids intra-bar flicker.
3) Quality scoring (0–100)
• Volume expansion vs 20-bar average — up to 25 points
• ATR-normalized slope steepness — up to 20 points
• Break-bar impulse measured in ATR from the line — up to 25 points
• Retest base score — 18 points, upgraded by +15 on a held retest, or reduced by 10 on a failed retest
• Major trendline bonus — +10 points
4) Retest tracking
After a break, the script watches a configurable window (default 3–8 bars) for price to return to the broken trendline within an ATR tolerance. Held retests and failed retests are tracked independently and reflected in the panel's Retest Held Rate. Retest markers are offset from the trendline in ATR units to prevent overlap with candles.
📊 SIGNALS & STATES
• Break label: "BREAK Q:<score> · <direction>" and an optional "MAJ" tag for Major trendlines. Label color tier: High quality renders in full state color, Medium quality in neutral amber, Low quality in a muted tone.
• Retest marker: Small circular marker with "retest held" or "retest failed" text, offset from the trendline for clarity.
• Break bar border: Optional candle-border color that reflects break direction.
• Panel: Active trendlines per side, last break score and direction, overall break-direction breakdown, retest held rate, quality distribution (High/Medium/Low), total breaks tracked, and the current detection mode.
• Alerts: "High Quality Trendline Break" and "Major Trendline Break" — both standard alertcondition entries.
🎛️ KEY INPUTS
• Major / Minor Pivot Length — controls how many bars each side of a pivot must be a local extreme.
• Show Minor Trendlines — toggle tactical layer on top of structural layer.
• Max Active Trendlines per Side — caps the chart clutter.
• Volume Spike Threshold (x Avg) — ratio at which a volume expansion is considered full.
• Retest Min/Max Bars — bar range for a valid retest.
• Retest Tolerance (ATR) — how close price must come to the broken line to count as a retest.
• High / Medium Quality Thresholds — cutoffs for the three quality tiers (defaults: 70 / 50).
• Show Trendline Zone Band — renders a subtle ATR-based band around Major trendlines.
• Zone Band Width (ATR) — controls the thickness of the zone band.
• Label Confluence Grouping (ATR) — merges break labels that land within this ATR distance on nearby bars.
• Label Offset (ATR) — vertical padding so labels never embed in candles.
• Label / Panel / Help font sizes — all default to Normal.
• Panel Position and Theme — six positions, Dark/Light theme.
🧩 HOW TO USE
The indicator is a decision-support layer, not a standalone trading system.
• Treat a break with Q ≥ 70 and a "MAJ" tag as a structural event worth reviewing the higher-timeframe bias for.
• Use the retest window as a patience filter. A break with Q 55–69 that retests and holds often upgrades to a higher-quality setup after the retest.
• Failed retests are not "bad" — they are information. A failed retest on a low-quality break is a strong hint that the break was noise.
• The neutral-color active trendlines are intentional — they tell you where structure exists without biasing your read. Color appears only when structure breaks.
• Combine with your own confluence (volume profile, horizontal support/resistance, higher-timeframe trend). The script does not enter trades; it tells you how reliable a break looks at the moment it happens.
⚠️ LIMITATIONS & TRANSPARENCY
• Quality scores describe historical pattern behavior. They are not predictive probabilities.
• Trendlines are generated from pivots; the final pivot is always confirmed after the pivot-length bars have elapsed. This is standard pivot behavior and is not a repaint of historical marks — past labels remain fixed once a break bar closes.
• The script draws up to the platform's line/label limits. Older trendlines are removed when the active cap is reached.
• Parameter defaults target 4H–1D charts; lower timeframes benefit from smaller pivot lengths and tighter retest windows.
📜 RISK DISCLOSURE
This script is an analytical tool. It does not provide financial advice, investment recommendations, or a trading strategy. Past performance of any pattern, including trendline breaks, does not guarantee future results. Always perform your own analysis and apply proper risk management before making any trading decision.
🔹 OVERVIEW
Auto Trendline Break Quality is a structural break-quality engine. It automatically detects bullish and bearish trendlines from swing pivots, monitors every break event in real time, and assigns each break a 0–100 quality score derived from four independent quantitative factors. The tool separates Major (structural) and Minor (tactical) trendlines, so the same break can be evaluated against multiple layers of market structure at once.
The script is purpose-built to answer the single most practical question a price-action trader faces at a trendline break: "Is this break real, or is it a fake-out?"
🧭 UNIQUE EDGE
Most trendline scripts either draw trendlines or flag a break. They stop there. This indicator continues where they stop — and measures the break.
Key differentiators:
• Four-factor composite quality score (Volume · Slope · Impulse · Retest) calibrated to ATR, so the scoring is consistent across assets and timeframes.
• Major/Minor trendline hierarchy. A Major structural break automatically earns a score bonus and is visually flagged with a "MAJ" tag, so structural breaks are never confused with noise breaks.
• State-based visual language. Active trendlines render in a neutral tone. On break, the trendline transitions to the break-direction color (bullish break = bull color, bearish break = bear color), so the chart communicates state without ambiguity.
• Retest logic built directly into the score. A break that is retested and holds within the defined window receives an upgrade; a failed retest downgrades the score. The chart label reflects the final, updated quality.
• Optional zone-band rendering around Major trendlines, letting the user see each structural line as a reaction zone rather than a bare line.
• Label confluence grouping to prevent chart clutter when multiple breaks occur near the same price level.
⚙️ METHODOLOGY
1) Trendline detection
Pivots are identified using standard pivot-high and pivot-low logic with two configurable lookbacks — one for Major trendlines and one for Minor. A new trendline is validated between the two most recent same-side pivots when the slope (ATR-normalized) exceeds the minimum threshold. Nearly-flat trendlines are rejected by design.
2) Break detection
A trendline is considered broken when the current candle closes on the opposite side of the projected line while the previous candle closed on the valid side. This one-bar confirmation rule avoids intra-bar flicker.
3) Quality scoring (0–100)
• Volume expansion vs 20-bar average — up to 25 points
• ATR-normalized slope steepness — up to 20 points
• Break-bar impulse measured in ATR from the line — up to 25 points
• Retest base score — 18 points, upgraded by +15 on a held retest, or reduced by 10 on a failed retest
• Major trendline bonus — +10 points
4) Retest tracking
After a break, the script watches a configurable window (default 3–8 bars) for price to return to the broken trendline within an ATR tolerance. Held retests and failed retests are tracked independently and reflected in the panel's Retest Held Rate. Retest markers are offset from the trendline in ATR units to prevent overlap with candles.
📊 SIGNALS & STATES
• Break label: "BREAK Q:<score> · <direction>" and an optional "MAJ" tag for Major trendlines. Label color tier: High quality renders in full state color, Medium quality in neutral amber, Low quality in a muted tone.
• Retest marker: Small circular marker with "retest held" or "retest failed" text, offset from the trendline for clarity.
• Break bar border: Optional candle-border color that reflects break direction.
• Panel: Active trendlines per side, last break score and direction, overall break-direction breakdown, retest held rate, quality distribution (High/Medium/Low), total breaks tracked, and the current detection mode.
• Alerts: "High Quality Trendline Break" and "Major Trendline Break" — both standard alertcondition entries.
🎛️ KEY INPUTS
• Major / Minor Pivot Length — controls how many bars each side of a pivot must be a local extreme.
• Show Minor Trendlines — toggle tactical layer on top of structural layer.
• Max Active Trendlines per Side — caps the chart clutter.
• Volume Spike Threshold (x Avg) — ratio at which a volume expansion is considered full.
• Retest Min/Max Bars — bar range for a valid retest.
• Retest Tolerance (ATR) — how close price must come to the broken line to count as a retest.
• High / Medium Quality Thresholds — cutoffs for the three quality tiers (defaults: 70 / 50).
• Show Trendline Zone Band — renders a subtle ATR-based band around Major trendlines.
• Zone Band Width (ATR) — controls the thickness of the zone band.
• Label Confluence Grouping (ATR) — merges break labels that land within this ATR distance on nearby bars.
• Label Offset (ATR) — vertical padding so labels never embed in candles.
• Label / Panel / Help font sizes — all default to Normal.
• Panel Position and Theme — six positions, Dark/Light theme.
🧩 HOW TO USE
The indicator is a decision-support layer, not a standalone trading system.
• Treat a break with Q ≥ 70 and a "MAJ" tag as a structural event worth reviewing the higher-timeframe bias for.
• Use the retest window as a patience filter. A break with Q 55–69 that retests and holds often upgrades to a higher-quality setup after the retest.
• Failed retests are not "bad" — they are information. A failed retest on a low-quality break is a strong hint that the break was noise.
• The neutral-color active trendlines are intentional — they tell you where structure exists without biasing your read. Color appears only when structure breaks.
• Combine with your own confluence (volume profile, horizontal support/resistance, higher-timeframe trend). The script does not enter trades; it tells you how reliable a break looks at the moment it happens.
⚠️ LIMITATIONS & TRANSPARENCY
• Quality scores describe historical pattern behavior. They are not predictive probabilities.
• Trendlines are generated from pivots; the final pivot is always confirmed after the pivot-length bars have elapsed. This is standard pivot behavior and is not a repaint of historical marks — past labels remain fixed once a break bar closes.
• The script draws up to the platform's line/label limits. Older trendlines are removed when the active cap is reached.
• Parameter defaults target 4H–1D charts; lower timeframes benefit from smaller pivot lengths and tighter retest windows.
📜 RISK DISCLOSURE
This script is an analytical tool. It does not provide financial advice, investment recommendations, or a trading strategy. Past performance of any pattern, including trendline breaks, does not guarantee future results. Always perform your own analysis and apply proper risk management before making any trading decision.
Release Note
🔧 UPDATE NOTES - V1.3This update focuses on decision quality, retest planning, visual clarity, and a more selective trendline-break workflow.
The core purpose of the script remains unchanged.
Auto Trendline Break Quality still evaluates confirmed trendline breaks with a 0-100 quality score.
This release improves how the existing logic is presented, organized, and interpreted on the chart.
This script continues to function as an analytical and visualization tool.
It does not attempt to predict price direction or provide guaranteed outcomes.
------------------------
What Changed
------------------------
• Planner-style break state
The script now frames each confirmed trendline break as a decision workflow instead of only a score event.
• Retest pocket visualization
A compact retest pocket is drawn around the broken trendline during the retest window, with the label centered inside the pocket.
• Target and invalidation rails
The latest break can now show a lightweight target reference and invalidation rail so users can read the setup as a structured plan.
• Cleaner action logic
The panel now summarizes Break Side, Break Quality, Retest Risk, Line Strength, and Action.
• More selective confirmation control
A new confirmation mode lets users keep the original close-break behavior or require volume or impulse confirmation.
• Retest failure warning
Failed retests now receive clearer chart language and a dedicated alert condition.
• Screenshot-balanced default preset
The default view now keeps advanced planner layers optional, caps visible break labels, and hides retest markers by default for a cleaner publication screenshot.
• Clearer closed-window action state
When the retest window closes without a valid retest, the panel now uses cleaner decision language instead of a mechanical expired/no-retest state.
• Live active-line extension
The newest unbroken trendline now refreshes forward on each bar, making it easier to watch whether price is approaching a valid trendline break.
• Optional broken-line forward guide
Confirmed broken lines can keep a short forward guide after the break when enabled, while the default screenshot preset keeps this historical extension off.
• Direct latest-line extension
The latest relevant trendline now extends directly into the right-side chart space, making the next possible break area easier to monitor without a separate dashed segment.
------------------------
Visual Improvements
------------------------
• Refined chart readability with compact two-line break labels
• Shortened default label text to reduce visual weight on the chart
• Increased trendline weight slightly so primary structure remains visible on dark TradingView screenshots
• Added a centered retest-pocket label for the active break zone
• Retest pocket, target rail, invalidation rail, and retest markers remain available from inputs but no longer dominate the default chart
• Reduced panel noise by replacing broad statistics with five decision-focused rows
• Kept the AGPro merged blue header row unchanged and publication-standard
• Preserved restrained colors and moderate label density for a cleaner premium chart
------------------------
Interface & Usability
------------------------
• Added Show Retest Pocket control
• Added Show Target / Invalidation Rails control
• Added Ready Break Threshold control
• Added Confirmation Mode control
• Added Break Label Cooldown Bars and Max Retest Markers controls
• Panel location, panel theme, panel visibility, panel font size, and label font size remain configurable
------------------------
Behavior Notes
------------------------
This update does not turn the script into Auto Trendlines MTF.
It remains focused on single-chart trendline break quality, retest planning, and break-state interpretation.
The goal is to improve clarity and usability, not to introduce predictive behavior.
Users should interpret outputs the same way as before, but with stronger structure around retest risk, invalidation context, and next-action state.
------------------------
Limitations Reminder
------------------------
The script remains a rule-based analytical tool.
Trendline pivots are confirmed after their pivot window closes.
Market conditions such as volatility, liquidity, and timeframe differences may affect how breaks, retests, and planner rails appear.
Outputs should always be interpreted within broader market context.
------------------------
Risk Reminder
------------------------
This script is for educational and analytical purposes only.
It does not provide financial advice or guaranteed trading outcomes.
Users remain responsible for their own decisions.
Release Note
🔧 UPDATE NOTES - [1.4]This update focuses on contrast, readability, and honest validation.
The core purpose of the script remains unchanged.
This release improves how the existing break-quality logic is presented and
interpreted on the chart, and adds an empirical follow-through proof rate.
This script continues to function as an analytical and visualization tool.
It does not attempt to predict price direction or provide guaranteed outcomes.
------------------------
What Changed
------------------------
• Added a stop-aware Follow-Through Proof rate
A new panel row tracks how often a confirmed trendline break holds and follows
through. A break is treated as held until price closes back through the broken
trendline (the script's own invalidation); a confirmed continuation of 1.2 ATR
before that reclaim counts as a success. It is evaluated only on confirmed bars,
and until at least 6 samples exist it shows "Building (n)" and remains
uncounted, so the figure stays honest.
• Applied a luminance-based contrast rule to all on-chart text
Break labels, retest pocket badges, planner rail labels, and retest markers now
choose their text color for readability, so text is never lost on bright fills
such as the amber and bullish backgrounds.
• Made weak-break labels opaque and clearer
Low-quality break labels now use an opaque muted slate fill instead of a
semi-transparent background, so they read cleanly without candles bleeding
through.
• Elevated the panel readout
Break Quality, Follow-Through Proof, and Action now render on filled
state-colored cells with contrast-aware text for clearer first-glance reading.
• Hardened ATR handling
All ATR-based sizing now uses a guarded ATR with true-range and mintick
fallbacks for stability on thin or early data.
------------------------
Visual Improvements
------------------------
• Improved chart readability by adjusting label contrast and weak-state fills
• Reduced the chance of unreadable text on colored break labels and badges
• Added vertical anti-collision so stacked break labels separate cleanly on
compressed and higher-timeframe views
• Refined visual hierarchy so the latest confirmed break and its action stand out
------------------------
Interface & Usability
------------------------
• Optimized panel layout for clearer information flow (Break Side, Break Quality,
Retest Risk, Follow-Through Proof, Line Strength, Action)
• Improved value readability with contrast-aware colored cells
• Adjusted default visual settings for a more balanced appearance
• Enhanced overall user experience without changing the core break logic
------------------------
Behavior Notes
------------------------
This update does not change the core analytical logic of the script.
The goal is to improve clarity and usability and to add transparent validation,
not to introduce new predictive behavior.
Users should interpret outputs the same way as before, but with improved visual
structure and an added empirical context figure.
------------------------
Limitations Reminder
------------------------
The script remains a rule-based analytical tool.
Market conditions such as volatility, liquidity, and timeframe differences may
affect how breaks and retests appear, and the proof rate is a historical sample,
not a forecast.
Outputs should always be interpreted within broader market context.
------------------------
Risk Reminder
------------------------
This script is for educational and analytical purposes only.
It does not provide financial advice or guaranteed trading outcomes.
Users remain responsible for their own decisions.
สคริปต์โอเพนซอร์ซ
ด้วยเจตนารมณ์หลักของ TradingView ผู้สร้างสคริปต์นี้ได้ทำให้เป็นโอเพนซอร์ส เพื่อให้เทรดเดอร์สามารถตรวจสอบและยืนยันฟังก์ชันการทำงานของมันได้ ขอชื่นชมผู้เขียน! แม้ว่าคุณจะใช้งานได้ฟรี แต่โปรดจำไว้ว่าการเผยแพร่โค้ดซ้ำจะต้องเป็นไปตาม กฎระเบียบการใช้งาน ของเรา

Public-free scripts + invite-only AGPro workflows for market analysis, liquidity context, risk planning and execution review.
Rules-based. No hype. No guesswork.
Library & access: agprolabs.com/
Telegram: t.me/agprolabs
Rules-based. No hype. No guesswork.
Library & access: agprolabs.com/
Telegram: t.me/agprolabs
คำจำกัดสิทธิ์ความรับผิดชอบ
ข้อมูลและบทความไม่ได้มีวัตถุประสงค์เพื่อก่อให้เกิดกิจกรรมทางการเงิน, การลงทุน, การซื้อขาย, ข้อเสนอแนะ หรือคำแนะนำประเภทอื่น ๆ ที่ให้หรือรับรองโดย TradingView อ่านเพิ่มเติมใน ข้อกำหนดการใช้งาน
สคริปต์โอเพนซอร์ซ
ด้วยเจตนารมณ์หลักของ TradingView ผู้สร้างสคริปต์นี้ได้ทำให้เป็นโอเพนซอร์ส เพื่อให้เทรดเดอร์สามารถตรวจสอบและยืนยันฟังก์ชันการทำงานของมันได้ ขอชื่นชมผู้เขียน! แม้ว่าคุณจะใช้งานได้ฟรี แต่โปรดจำไว้ว่าการเผยแพร่โค้ดซ้ำจะต้องเป็นไปตาม กฎระเบียบการใช้งาน ของเรา
Public-free scripts + invite-only AGPro workflows for market analysis, liquidity context, risk planning and execution review.
Rules-based. No hype. No guesswork.
Library & access: agprolabs.com/
Telegram: t.me/agprolabs
Rules-based. No hype. No guesswork.
Library & access: agprolabs.com/
Telegram: t.me/agprolabs
คำจำกัดสิทธิ์ความรับผิดชอบ
ข้อมูลและบทความไม่ได้มีวัตถุประสงค์เพื่อก่อให้เกิดกิจกรรมทางการเงิน, การลงทุน, การซื้อขาย, ข้อเสนอแนะ หรือคำแนะนำประเภทอื่น ๆ ที่ให้หรือรับรองโดย TradingView อ่านเพิ่มเติมใน ข้อกำหนดการใช้งาน