SMC Fibonacci Navigator PRO
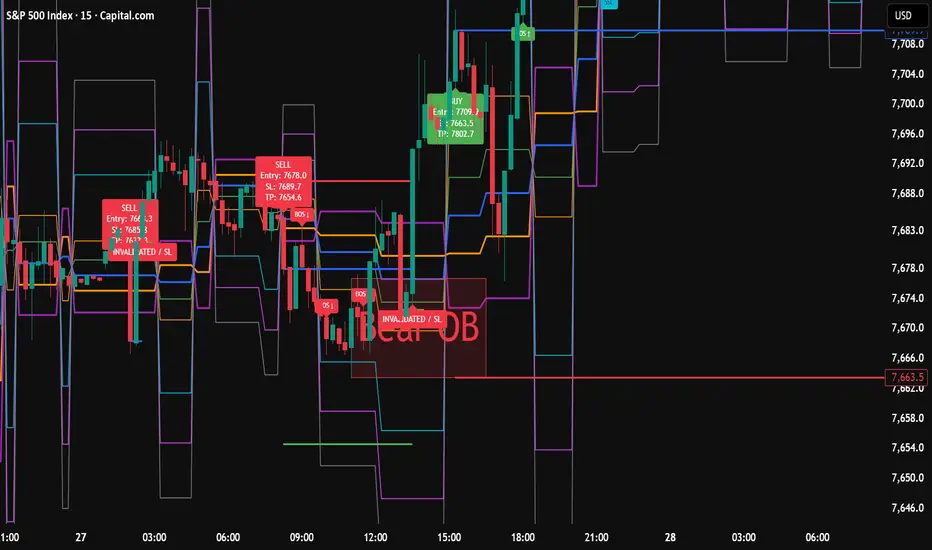
# SMC Fibonacci Navigator PRO
## Overview
**SMC Fibonacci Navigator PRO** is a Smart Money Concepts (SMC) indicator designed to help traders analyze market structure, identify potential liquidity areas, highlight institutional-style price zones, and map Fibonacci retracement and extension levels directly on the chart.
The indicator combines several price-action tools into one visual framework to help traders identify potential trading opportunities and manage trade levels more systematically.
## Key Features
* **Market Structure Analysis:** Identifies potential bullish and bearish structure breaks and displays market structure shift (MSS) signals.
* **Liquidity Levels:** Highlights potential Buy-Side Liquidity (BSL) and Sell-Side Liquidity (SSL) around swing highs and swing lows.
* **Order Blocks:** Marks potential bullish and bearish order block zones based on recent price action.
* **Fair Value Gaps (FVG):** Highlights potential price imbalances that traders may monitor for future reactions.
* **Fibonacci Levels:** Displays Fibonacci retracement levels and extensions based on detected swing movements.
* **Trade Levels:** Provides visual entry, stop-loss, and take-profit levels based on the indicator's internal trade logic and configured risk-to-reward ratio.
* **Alerts:** Supports alerts for selected market structure and trading events.
## How to Use
### 1. Identify Market Structure
Monitor bullish and bearish structure breaks to understand potential changes in market direction. MSS labels may help highlight possible shifts in market behavior.
### 2. Monitor Liquidity
Use BSL and SSL levels to identify areas around swing highs and lows where liquidity may be concentrated. These levels are areas of interest, not guaranteed reversal points.
### 3. Analyze Order Blocks and FVGs
Observe bullish and bearish order blocks alongside Fair Value Gaps to identify potential reaction zones. Consider how price behaves when it revisits these areas.
### 4. Use Fibonacci Levels
Use the displayed Fibonacci levels to analyze potential retracement areas and extension targets within detected price swings.
### 5. Manage Trade Levels
When the indicator displays a potential Buy or Sell setup, review the entry, stop-loss, and take-profit levels before making a decision. Always consider market conditions, volatility, spread, and your personal risk-management rules.
### 6. Configure Alerts
Create TradingView alerts using the conditions available in the indicator's alert menu. Select the appropriate condition and configure the notification method you prefer.
## Recommended Workflow
1. Start by reviewing the overall market structure.
2. Identify nearby liquidity levels and potential reaction zones.
3. Check the relevant order blocks, FVGs, and Fibonacci levels.
4. Review the displayed trade levels and risk-to-reward settings.
5. Wait for price confirmation when appropriate, and manage risk on every trade.
## Important Notes
SMC Fibonacci Navigator PRO is an analytical tool, not an automated guarantee of profitable trades. Its drawings and signals are generated by programmed rules and may not reflect every trader's interpretation of Smart Money Concepts.
No indicator can predict future price movements with certainty. Always test the indicator on historical data and in a simulated environment before using it in live trading.
**Risk Disclaimer:** This indicator is provided for educational and informational purposes only. It does not constitute financial or investment advice. Trading financial markets involves substantial risk, and you are responsible for your own trading decisions.
---
## Overview
**SMC Fibonacci Navigator PRO** is a Smart Money Concepts (SMC) indicator designed to help traders analyze market structure, identify potential liquidity areas, highlight institutional-style price zones, and map Fibonacci retracement and extension levels directly on the chart.
The indicator combines several price-action tools into one visual framework to help traders identify potential trading opportunities and manage trade levels more systematically.
## Key Features
* **Market Structure Analysis:** Identifies potential bullish and bearish structure breaks and displays market structure shift (MSS) signals.
* **Liquidity Levels:** Highlights potential Buy-Side Liquidity (BSL) and Sell-Side Liquidity (SSL) around swing highs and swing lows.
* **Order Blocks:** Marks potential bullish and bearish order block zones based on recent price action.
* **Fair Value Gaps (FVG):** Highlights potential price imbalances that traders may monitor for future reactions.
* **Fibonacci Levels:** Displays Fibonacci retracement levels and extensions based on detected swing movements.
* **Trade Levels:** Provides visual entry, stop-loss, and take-profit levels based on the indicator's internal trade logic and configured risk-to-reward ratio.
* **Alerts:** Supports alerts for selected market structure and trading events.
## How to Use
### 1. Identify Market Structure
Monitor bullish and bearish structure breaks to understand potential changes in market direction. MSS labels may help highlight possible shifts in market behavior.
### 2. Monitor Liquidity
Use BSL and SSL levels to identify areas around swing highs and lows where liquidity may be concentrated. These levels are areas of interest, not guaranteed reversal points.
### 3. Analyze Order Blocks and FVGs
Observe bullish and bearish order blocks alongside Fair Value Gaps to identify potential reaction zones. Consider how price behaves when it revisits these areas.
### 4. Use Fibonacci Levels
Use the displayed Fibonacci levels to analyze potential retracement areas and extension targets within detected price swings.
### 5. Manage Trade Levels
When the indicator displays a potential Buy or Sell setup, review the entry, stop-loss, and take-profit levels before making a decision. Always consider market conditions, volatility, spread, and your personal risk-management rules.
### 6. Configure Alerts
Create TradingView alerts using the conditions available in the indicator's alert menu. Select the appropriate condition and configure the notification method you prefer.
## Recommended Workflow
1. Start by reviewing the overall market structure.
2. Identify nearby liquidity levels and potential reaction zones.
3. Check the relevant order blocks, FVGs, and Fibonacci levels.
4. Review the displayed trade levels and risk-to-reward settings.
5. Wait for price confirmation when appropriate, and manage risk on every trade.
## Important Notes
SMC Fibonacci Navigator PRO is an analytical tool, not an automated guarantee of profitable trades. Its drawings and signals are generated by programmed rules and may not reflect every trader's interpretation of Smart Money Concepts.
No indicator can predict future price movements with certainty. Always test the indicator on historical data and in a simulated environment before using it in live trading.
**Risk Disclaimer:** This indicator is provided for educational and informational purposes only. It does not constitute financial or investment advice. Trading financial markets involves substantial risk, and you are responsible for your own trading decisions.
---

คำจำกัดสิทธิ์ความรับผิดชอบ
ข้อมูลและบทความไม่ได้มีวัตถุประสงค์เพื่อก่อให้เกิดกิจกรรมทางการเงิน, การลงทุน, การซื้อขาย, ข้อเสนอแนะ หรือคำแนะนำประเภทอื่น ๆ ที่ให้หรือรับรองโดย TradingView อ่านเพิ่มเติมใน ข้อกำหนดการใช้งาน
คำจำกัดสิทธิ์ความรับผิดชอบ
ข้อมูลและบทความไม่ได้มีวัตถุประสงค์เพื่อก่อให้เกิดกิจกรรมทางการเงิน, การลงทุน, การซื้อขาย, ข้อเสนอแนะ หรือคำแนะนำประเภทอื่น ๆ ที่ให้หรือรับรองโดย TradingView อ่านเพิ่มเติมใน ข้อกำหนดการใช้งาน