ที่อัปเดต:
KTI-G (Known Trends Index-Gold)
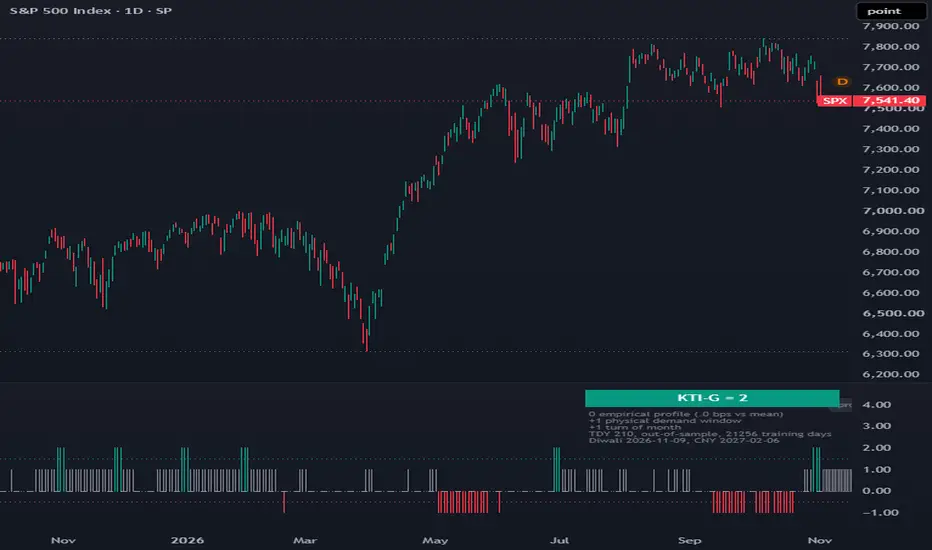
█ OVERVIEW
Known Trends Index - Gold (KTI-G) plots, in a separate pane, a daily integer score that sums the calendar patterns in force on each trading day of a gold chart. The thesis is that gold's seasonal tendencies are better tested by letting the chart's own history define the profile, with a hard in-sample cutoff, than by hardcoding windows taken from published sources.
█ HISTORY / BACKGROUND
The index design follows the Known Trends Index that Jay Kaeppel described for the US equity market: each known seasonal trend contributes one point while it is active, and the sum is read as a favorable, neutral, or unfavorable climate rather than as a trade signal. This script applies that summation structure to gold and changes what the components are.
The literature on gold seasonality has not aged well at the level of specific months. A 2013 academic study of London gold prices from 1980 to 2010 found September and November to be the only months with positive and statistically significant returns. A 2024 replication reported a structural break around December 2010, after which those two months turned negative and January became the significant month. Practitioner windows for gold, including Kaeppel's own trading-day-of-year windows for gold futures, describe the same broad second-half and winter tendency with dates that differ by source.
The one part of the story with a physical mechanism is demand. Indian jewelry buying peaks around Diwali and the wedding season that follows it, and Chinese buying rises in the weeks before the lunar new year. Both festivals move on the lunar calendar, so fixed calendar dates describe them poorly.
The script therefore keeps three fixed components with a stated rationale (physical demand with lunar dates, turn of month, and September as a contested pattern), keeps Kaeppel's windows only as an optional comparison overlay, and gives the largest role to an empirical profile learned from the chart with no lookahead.
█ HOW IT WORKS
All date arithmetic runs on GMT-noon timestamps built from the bar's year, month, and day, so the logic is independent of the chart's exchange timezone. A US market holiday calendar is generated for the current year plus one year on either side (New Year's Day, Martin Luther King Day from 1998, Presidents Day, Good Friday by the Gregorian Easter algorithm, Memorial Day, Juneteenth from 2022, Independence Day, Labor Day, Thanksgiving, Christmas). A trading day is a weekday not in that calendar.
Two counters are maintained per bar: the trading day of month (TDOM) and the trading day of year (TDY). TDY is computed by counting calendar trading days between consecutive bars, so it stays correct across missing bars in the chart data.
The components are computed in this order.
1. Empirical profile. Two arrays of 252 slots accumulate the sum and count of daily returns (close divided by prior close, minus one) by TDY. On each bar the component is scored first, using only what has already been accumulated, and the bar's own return is added afterward. The score compares the smoothed profile for the bar's TDY against the unconditional mean daily return: the smoothed value is the mean return over a circular window of plus or minus the smoothing half-width in TDY slots. The score is +1 when the smoothed value exceeds the unconditional mean by the threshold, -1 when it falls below the mean by the threshold, and 0 otherwise. No score is produced until the accumulated count reaches the minimum number of years multiplied by 250. Accumulation stops after the training end date when the freeze option is on; otherwise it continues as an expanding window. TDY values above 252 fold into slot 252.
2. Physical demand. Diwali is computed for the prior and current year as the new moon nearest November 1, taken as a date in India Standard Time. Chinese New Year is computed for the current and next year as the second new moon after December 21 of the preceding year, taken as a date in Beijing time. New moon instants come from the Meeus mean-phase series with the fourteen largest periodic corrections. The component is +1 from 15 calendar days before Diwali through 45 days after it, and from 30 calendar days before Chinese New Year through the day before it. Overlapping windows do not add.
3. Turn of month. +1 on the last two trading days of a month and the first trading day of the next month.
4. September. The user-set September weight on every bar in September, 0 by default.
5. Kaeppel overlay. Off by default. When on, +1 for TDY 250 through year end and TDY 1 through 38, -1 for TDY 39 through 134, +1 for TDY 135 through 188, -1 for TDY 189 through 249.
KTI-G is the sum of the five components. With default settings the possible range is -3 to +4.
On the last bar of a daily chart the script walks every calendar day from January 1 of the current year through February 28 of the next year, rebuilding TDOM and TDY along the way, evaluates the same component function for each future trading day after the current bar, and draws one box per nonzero value in the right margin. The projection uses the profile arrays as they stand on the last bar. The boxes are deleted and redrawn once per new trading day.
█ HOW TO USE
Apply the script to a daily chart of a gold futures continuous contract, a gold bullion fund, or a gold miner proxy. The code is written for daily bars because every component is defined per trading day; on any other timeframe the main plot returns na and the table shows a notice.
The column plot is the index. Teal columns are readings of 2 or higher, gray columns are 0 or 1, red columns are -1 or lower. Two dotted horizontal lines mark the boundaries at 1.5 and -0.5, and a solid line marks zero. These zone cutoffs are the author's choice and are not taken from any published source; they should be re-examined after inspecting the distribution of readings on the chosen symbol.
The semi-transparent boxes to the right of the last bar are the projected index for each future trading day through February 28 of next year, colored by the same zone rule. A small label marks the first projected day. Zero-value future days draw no box.
The table in the top right shows the current reading, the value and sign of each active component, the profile deviation from the mean in basis points per day, the TDY, whether the bar is in-sample or out-of-sample relative to the training end, the number of training days accumulated, and the computed dates of the current year's Diwali and next year's Chinese New Year.
Eight hidden series are available in the Data Window and in chart data export: each of the five components, the profile deviation in basis points, the TDY, and an in-sample flag. These exist so that the components active during any drawdown can be inspected bar by bar.
The intended use is diagnostic. With the freeze option on, every bar after the training end date is a clean out-of-sample test of whether the seasonal shape learned from the earlier period persisted on that symbol. Comparing the frozen result against the expanding-window result shows whether the shape moved.
█ SETTINGS
Show active components (on): draws the table.
Project through Feb 28 of next year (on): draws the forward projection boxes and label.
Empirical profile
• Empirical TDY profile (on): includes the empirical component in the sum.
• Training end (2010-12-31): last date whose return is accumulated into the profile when freezing is on. The default is the break date reported in the 2024 replication study.
• Freeze profile at training end (on): stops accumulation after the training end. Off gives an expanding window that keeps learning.
• Smoothing half-width (10): number of TDY slots on each side of the current slot averaged together, 0 to 40.
• Threshold vs. mean (3.0 bps/day): the profile must differ from the unconditional mean by this amount to score +1 or -1.
• Minimum years before scoring (10): the empirical component returns 0 until this many years of daily returns, at 250 per year, have been accumulated.
Fixed components
• Physical demand, lunar Diwali + CNY (on).
• Turn of month (on).
• September weight (0): -1, 0, or +1 applied on September bars.
• Kaeppel TDY windows overlay (off).
█ WHAT MAKES IT ORIGINAL
The script combines four things that are not, to the author's knowledge, found together in a published gold seasonality indicator.
First, the seasonal profile is learned from the chart with no lookahead and a user-set in-sample cutoff, so the out-of-sample record of gold seasonality on any symbol can be read directly from the plot rather than inferred from a fixed set of published dates.
Second, the demand component uses computed lunar dates for Diwali and Chinese New Year, generated in the script from a new-moon series, instead of fixed Gregorian windows that drift against the festivals by up to a month.
Third, the trading-day-of-year and trading-day-of-month counters are built from a generated holiday calendar and count calendar trading days between bars, so the index is robust to gaps in the symbol's data and can be projected forward for dates that have no bars yet.
Fourth, every component is exposed as its own series so that a reading can be decomposed on any historical bar, which is the step needed to find out which pattern was active when the index was wrong.
█ NOTES / LIMITATIONS
• The empirical component needs at least the minimum years of daily history before the training end date to score at all. A symbol whose data begins after the training end never scores that component while freezing is on; lower the minimum, move the training end, or turn freezing off. The table's training-day count shows how much history has been used.
• The main plot is na on any timeframe other than daily, and the table displays a notice.
• There is no request.security call and no lookahead. The empirical score on a bar uses only returns from earlier bars. The projection boxes and table are rebuilt on the last bar only; historical columns do not repaint.
• The forward projection is date-bounded at February 28 of the year after the chart's last bar. It rolls forward each calendar year and is not extended beyond that date.
• The projection uses the profile as it stands on the last bar. With freezing off, the projected values can change from day to day as the profile continues to learn.
• Trading-day math uses a US exchange holiday calendar. Gold futures trade on a calendar that differs by a day in some years, and special unscheduled closures are not modeled, so TDY values can be offset by one relative to a futures exchange count in those years.
• Diwali and Chinese New Year dates are computed astronomically and can differ from the observed festival by one day. Rare lunar leap-month cases for Chinese New Year are not handled.
• The zone thresholds and the demand window lengths are the author's constructions. Published seasonal patterns have shown decay after publication, and nothing in this script should be read as a forecast.
• The script uses up to 500 boxes for the projection; a projection window of roughly 300 trading days stays within that ceiling. Per-bar loops are bounded by the smoothing window (at most 81 slots) and the calendar-day gap between consecutive bars.
Known Trends Index - Gold (KTI-G) plots, in a separate pane, a daily integer score that sums the calendar patterns in force on each trading day of a gold chart. The thesis is that gold's seasonal tendencies are better tested by letting the chart's own history define the profile, with a hard in-sample cutoff, than by hardcoding windows taken from published sources.
█ HISTORY / BACKGROUND
The index design follows the Known Trends Index that Jay Kaeppel described for the US equity market: each known seasonal trend contributes one point while it is active, and the sum is read as a favorable, neutral, or unfavorable climate rather than as a trade signal. This script applies that summation structure to gold and changes what the components are.
The literature on gold seasonality has not aged well at the level of specific months. A 2013 academic study of London gold prices from 1980 to 2010 found September and November to be the only months with positive and statistically significant returns. A 2024 replication reported a structural break around December 2010, after which those two months turned negative and January became the significant month. Practitioner windows for gold, including Kaeppel's own trading-day-of-year windows for gold futures, describe the same broad second-half and winter tendency with dates that differ by source.
The one part of the story with a physical mechanism is demand. Indian jewelry buying peaks around Diwali and the wedding season that follows it, and Chinese buying rises in the weeks before the lunar new year. Both festivals move on the lunar calendar, so fixed calendar dates describe them poorly.
The script therefore keeps three fixed components with a stated rationale (physical demand with lunar dates, turn of month, and September as a contested pattern), keeps Kaeppel's windows only as an optional comparison overlay, and gives the largest role to an empirical profile learned from the chart with no lookahead.
█ HOW IT WORKS
All date arithmetic runs on GMT-noon timestamps built from the bar's year, month, and day, so the logic is independent of the chart's exchange timezone. A US market holiday calendar is generated for the current year plus one year on either side (New Year's Day, Martin Luther King Day from 1998, Presidents Day, Good Friday by the Gregorian Easter algorithm, Memorial Day, Juneteenth from 2022, Independence Day, Labor Day, Thanksgiving, Christmas). A trading day is a weekday not in that calendar.
Two counters are maintained per bar: the trading day of month (TDOM) and the trading day of year (TDY). TDY is computed by counting calendar trading days between consecutive bars, so it stays correct across missing bars in the chart data.
The components are computed in this order.
1. Empirical profile. Two arrays of 252 slots accumulate the sum and count of daily returns (close divided by prior close, minus one) by TDY. On each bar the component is scored first, using only what has already been accumulated, and the bar's own return is added afterward. The score compares the smoothed profile for the bar's TDY against the unconditional mean daily return: the smoothed value is the mean return over a circular window of plus or minus the smoothing half-width in TDY slots. The score is +1 when the smoothed value exceeds the unconditional mean by the threshold, -1 when it falls below the mean by the threshold, and 0 otherwise. No score is produced until the accumulated count reaches the minimum number of years multiplied by 250. Accumulation stops after the training end date when the freeze option is on; otherwise it continues as an expanding window. TDY values above 252 fold into slot 252.
2. Physical demand. Diwali is computed for the prior and current year as the new moon nearest November 1, taken as a date in India Standard Time. Chinese New Year is computed for the current and next year as the second new moon after December 21 of the preceding year, taken as a date in Beijing time. New moon instants come from the Meeus mean-phase series with the fourteen largest periodic corrections. The component is +1 from 15 calendar days before Diwali through 45 days after it, and from 30 calendar days before Chinese New Year through the day before it. Overlapping windows do not add.
3. Turn of month. +1 on the last two trading days of a month and the first trading day of the next month.
4. September. The user-set September weight on every bar in September, 0 by default.
5. Kaeppel overlay. Off by default. When on, +1 for TDY 250 through year end and TDY 1 through 38, -1 for TDY 39 through 134, +1 for TDY 135 through 188, -1 for TDY 189 through 249.
KTI-G is the sum of the five components. With default settings the possible range is -3 to +4.
On the last bar of a daily chart the script walks every calendar day from January 1 of the current year through February 28 of the next year, rebuilding TDOM and TDY along the way, evaluates the same component function for each future trading day after the current bar, and draws one box per nonzero value in the right margin. The projection uses the profile arrays as they stand on the last bar. The boxes are deleted and redrawn once per new trading day.
█ HOW TO USE
Apply the script to a daily chart of a gold futures continuous contract, a gold bullion fund, or a gold miner proxy. The code is written for daily bars because every component is defined per trading day; on any other timeframe the main plot returns na and the table shows a notice.
The column plot is the index. Teal columns are readings of 2 or higher, gray columns are 0 or 1, red columns are -1 or lower. Two dotted horizontal lines mark the boundaries at 1.5 and -0.5, and a solid line marks zero. These zone cutoffs are the author's choice and are not taken from any published source; they should be re-examined after inspecting the distribution of readings on the chosen symbol.
The semi-transparent boxes to the right of the last bar are the projected index for each future trading day through February 28 of next year, colored by the same zone rule. A small label marks the first projected day. Zero-value future days draw no box.
The table in the top right shows the current reading, the value and sign of each active component, the profile deviation from the mean in basis points per day, the TDY, whether the bar is in-sample or out-of-sample relative to the training end, the number of training days accumulated, and the computed dates of the current year's Diwali and next year's Chinese New Year.
Eight hidden series are available in the Data Window and in chart data export: each of the five components, the profile deviation in basis points, the TDY, and an in-sample flag. These exist so that the components active during any drawdown can be inspected bar by bar.
The intended use is diagnostic. With the freeze option on, every bar after the training end date is a clean out-of-sample test of whether the seasonal shape learned from the earlier period persisted on that symbol. Comparing the frozen result against the expanding-window result shows whether the shape moved.
█ SETTINGS
Show active components (on): draws the table.
Project through Feb 28 of next year (on): draws the forward projection boxes and label.
Empirical profile
• Empirical TDY profile (on): includes the empirical component in the sum.
• Training end (2010-12-31): last date whose return is accumulated into the profile when freezing is on. The default is the break date reported in the 2024 replication study.
• Freeze profile at training end (on): stops accumulation after the training end. Off gives an expanding window that keeps learning.
• Smoothing half-width (10): number of TDY slots on each side of the current slot averaged together, 0 to 40.
• Threshold vs. mean (3.0 bps/day): the profile must differ from the unconditional mean by this amount to score +1 or -1.
• Minimum years before scoring (10): the empirical component returns 0 until this many years of daily returns, at 250 per year, have been accumulated.
Fixed components
• Physical demand, lunar Diwali + CNY (on).
• Turn of month (on).
• September weight (0): -1, 0, or +1 applied on September bars.
• Kaeppel TDY windows overlay (off).
█ WHAT MAKES IT ORIGINAL
The script combines four things that are not, to the author's knowledge, found together in a published gold seasonality indicator.
First, the seasonal profile is learned from the chart with no lookahead and a user-set in-sample cutoff, so the out-of-sample record of gold seasonality on any symbol can be read directly from the plot rather than inferred from a fixed set of published dates.
Second, the demand component uses computed lunar dates for Diwali and Chinese New Year, generated in the script from a new-moon series, instead of fixed Gregorian windows that drift against the festivals by up to a month.
Third, the trading-day-of-year and trading-day-of-month counters are built from a generated holiday calendar and count calendar trading days between bars, so the index is robust to gaps in the symbol's data and can be projected forward for dates that have no bars yet.
Fourth, every component is exposed as its own series so that a reading can be decomposed on any historical bar, which is the step needed to find out which pattern was active when the index was wrong.
█ NOTES / LIMITATIONS
• The empirical component needs at least the minimum years of daily history before the training end date to score at all. A symbol whose data begins after the training end never scores that component while freezing is on; lower the minimum, move the training end, or turn freezing off. The table's training-day count shows how much history has been used.
• The main plot is na on any timeframe other than daily, and the table displays a notice.
• There is no request.security call and no lookahead. The empirical score on a bar uses only returns from earlier bars. The projection boxes and table are rebuilt on the last bar only; historical columns do not repaint.
• The forward projection is date-bounded at February 28 of the year after the chart's last bar. It rolls forward each calendar year and is not extended beyond that date.
• The projection uses the profile as it stands on the last bar. With freezing off, the projected values can change from day to day as the profile continues to learn.
• Trading-day math uses a US exchange holiday calendar. Gold futures trade on a calendar that differs by a day in some years, and special unscheduled closures are not modeled, so TDY values can be offset by one relative to a futures exchange count in those years.
• Diwali and Chinese New Year dates are computed astronomically and can differ from the observed festival by one day. Rare lunar leap-month cases for Chinese New Year are not handled.
• The zone thresholds and the demand window lengths are the author's constructions. Published seasonal patterns have shown decay after publication, and nothing in this script should be read as a forecast.
• The script uses up to 500 boxes for the projection; a projection window of roughly 300 trading days stays within that ceiling. Per-bar loops are bounded by the smoothing window (at most 81 slots) and the calendar-day gap between consecutive bars.
Release Note
v2.1 is a bug-fix release. The index design and default settings are unchanged.• Bar dates now come from time_tradingday. On symbols whose session opens the evening before, such as GC1! and TVC:GOLD, v2 read each bar's date from its open time and dated every bar one calendar day early. As a result, trading day of year ran one day behind, and the turn-of-month and Kaeppel windows fired on the wrong bars. Symbols with a same-day session, such as GLD, were not affected.
• A bar dated on a market holiday now moves to the next trading day. Since 2009, COMEX gold prints the combined holiday and next-day session under the holiday's date. When two bars share a trading date, the profile keeps one observation for that date: the return from the previous date's last close.
• Trading day of month is now counted from the holiday calendar, the same way trading day of year is, so gaps in the data no longer shift it.
• Chinese New Year is now counted from the lunar month that contains the winter solstice day in Beijing time. v2 compared new moons against a fixed December 21 cutoff, which put the holiday a month early in 1985, 1996 and 2015.
• Good Friday now uses integer division throughout. In Pine v6, dividing two integers keeps the fraction.
• The training cutoff now compares the trading date instead of the session open time.
• The script now requires a 1D chart. On 2D and longer daily timeframes it shows the notice.
• Projection boxes now line up with future bar times.
• The table now shows the next Chinese New Year date, including in January before the holiday.
Note on data: on an unadjusted continuous futures contract, roll days fall at fixed points in the calendar. Both the turn-of-month component and the empirical profile then record the roll gap as a seasonal return. A spot gold chart gives a cleaner profile, but on TVC:GOLD the bars before 1980 repeat GC1! data.

คำจำกัดสิทธิ์ความรับผิดชอบ
ข้อมูลและบทความไม่ได้มีวัตถุประสงค์เพื่อก่อให้เกิดกิจกรรมทางการเงิน, การลงทุน, การซื้อขาย, ข้อเสนอแนะ หรือคำแนะนำประเภทอื่น ๆ ที่ให้หรือรับรองโดย TradingView อ่านเพิ่มเติมใน ข้อกำหนดการใช้งาน
คำจำกัดสิทธิ์ความรับผิดชอบ
ข้อมูลและบทความไม่ได้มีวัตถุประสงค์เพื่อก่อให้เกิดกิจกรรมทางการเงิน, การลงทุน, การซื้อขาย, ข้อเสนอแนะ หรือคำแนะนำประเภทอื่น ๆ ที่ให้หรือรับรองโดย TradingView อ่านเพิ่มเติมใน ข้อกำหนดการใช้งาน