ที่อัปเดต:
Altcoin Open Interest (OI) Dominance (Coinalyze, ex-TradFi)
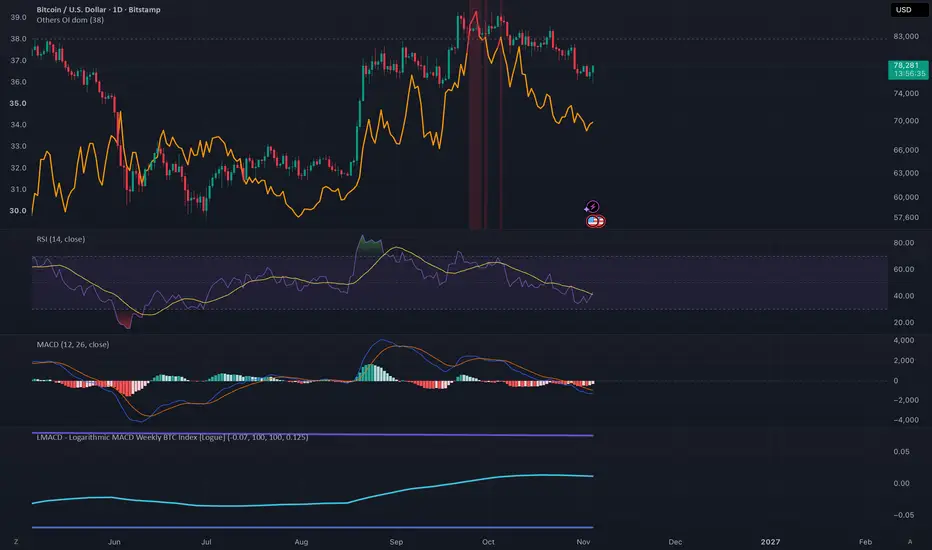
Altcoin Open Interest (OI) Dominance shows the share of total crypto futures open interest held by all coins other than BTC and ETH ("Others"). When this share is stretched, leverage is crowded into altcoins, which has historically appeared near local tops. When it collapses within a day or two, that leverage has just been flushed.
HOW IT'S BUILT
- Daily open interest for every futures market tracked by Coinalyze (USD, USDT and BUSD-quoted contracts, converted to USD), with TradFi derivatives (stocks, commodities, indices) excluded.
- Each day: Others OI / (BTC OI + ETH OI + Others OI) x 100.
- Pine Script cannot fetch external data, so the daily values are embedded in the script. I update the data regularly (roughly monthly), and each update is listed in the release notes.
HOW TO READ IT
- Orange line: Others share of open interest (%).
- Red line + red background: above the warning level (default 38%, adjustable). Alt leverage is crowded.
- Red triangle (flush): the share dropped 4+ points within 3 days, usually a liquidation cascade in alts.
- Alerts are available for both.
WHAT THE HISTORY SHOWS (Aug 2022 - Oct 2026)
- Mar 2024 (~43%) and Dec 2024 (~44%): both marked alt tops and both ended with a single-day collapse of ~5 points.
- Oct 2025 (~37.5%): elevated just before the October 2025 top, followed by a sharp flush.
- Dec 2023 (~41%): elevated, but it unwound gradually and the uptrend continued. A high reading alone is not a sell signal.
- Readings of ~24-27% came near the 2022-2023 lows.
In short: a high reading means crowded alt leverage, and a fast drop is what confirmed the actual tops. The sample is small, so use this as context alongside other tools, not as a standalone signal.
LIMITATIONS
- Data before ~Aug 2022 is not included due to API history limits.
- Values read ~2 percentage points higher than Coinalyze's own Dominance by Open Interest chart, likely because a few markets are classified differently. Levels are consistent within the script, and the default thresholds are calibrated on its own history.
- Two flush signals in mid-2023 (June and August) fired during broad market sell-offs while the share was low, not at alt tops. A flush is most meaningful when it follows a reading near or above the warning level.
- The line ends at the last data update and extends with each update.
- Best viewed on the daily timeframe.
- Not financial advice.
Data source: Coinalyze.
Last update: Oct 8, 2026.
HOW IT'S BUILT
- Daily open interest for every futures market tracked by Coinalyze (USD, USDT and BUSD-quoted contracts, converted to USD), with TradFi derivatives (stocks, commodities, indices) excluded.
- Each day: Others OI / (BTC OI + ETH OI + Others OI) x 100.
- Pine Script cannot fetch external data, so the daily values are embedded in the script. I update the data regularly (roughly monthly), and each update is listed in the release notes.
HOW TO READ IT
- Orange line: Others share of open interest (%).
- Red line + red background: above the warning level (default 38%, adjustable). Alt leverage is crowded.
- Red triangle (flush): the share dropped 4+ points within 3 days, usually a liquidation cascade in alts.
- Alerts are available for both.
WHAT THE HISTORY SHOWS (Aug 2022 - Oct 2026)
- Mar 2024 (~43%) and Dec 2024 (~44%): both marked alt tops and both ended with a single-day collapse of ~5 points.
- Oct 2025 (~37.5%): elevated just before the October 2025 top, followed by a sharp flush.
- Dec 2023 (~41%): elevated, but it unwound gradually and the uptrend continued. A high reading alone is not a sell signal.
- Readings of ~24-27% came near the 2022-2023 lows.
In short: a high reading means crowded alt leverage, and a fast drop is what confirmed the actual tops. The sample is small, so use this as context alongside other tools, not as a standalone signal.
LIMITATIONS
- Data before ~Aug 2022 is not included due to API history limits.
- Values read ~2 percentage points higher than Coinalyze's own Dominance by Open Interest chart, likely because a few markets are classified differently. Levels are consistent within the script, and the default thresholds are calibrated on its own history.
- Two flush signals in mid-2023 (June and August) fired during broad market sell-offs while the share was low, not at alt tops. A flush is most meaningful when it follows a reading near or above the warning level.
- The line ends at the last data update and extends with each update.
- Best viewed on the daily timeframe.
- Not financial advice.
Data source: Coinalyze.
Last update: Oct 8, 2026.
Release Note
Last update: Nov 4, 2026
คำจำกัดสิทธิ์ความรับผิดชอบ
ข้อมูลและบทความไม่ได้มีวัตถุประสงค์เพื่อก่อให้เกิดกิจกรรมทางการเงิน, การลงทุน, การซื้อขาย, ข้อเสนอแนะ หรือคำแนะนำประเภทอื่น ๆ ที่ให้หรือรับรองโดย TradingView อ่านเพิ่มเติมใน ข้อกำหนดการใช้งาน
คำจำกัดสิทธิ์ความรับผิดชอบ
ข้อมูลและบทความไม่ได้มีวัตถุประสงค์เพื่อก่อให้เกิดกิจกรรมทางการเงิน, การลงทุน, การซื้อขาย, ข้อเสนอแนะ หรือคำแนะนำประเภทอื่น ๆ ที่ให้หรือรับรองโดย TradingView อ่านเพิ่มเติมใน ข้อกำหนดการใช้งาน