ที่อัปเดต:
PULSE Trend - Breakout & ATR Trail Strategy
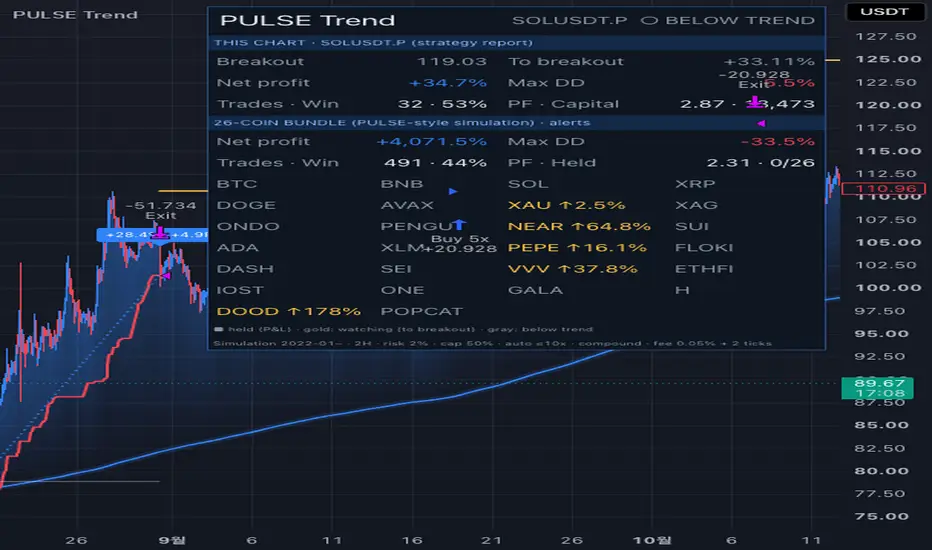
PULSE Trend is a long-only trend-following strategy for crypto. It stays out of the market while price is chopping sideways, buys only when price breaks out of a multi-week range above its long-term trend, and then rides the move with a wide trailing stop that only moves up. Most trades are small losses or small gains; a few strong trends produce most of the profit.
--------------------------------------------------
QUICK START (3 steps)
--------------------------------------------------
1. Open a 2-hour (2H) chart of a liquid USDT perpetual pair, for example BTC, ETH, SOL, XRP, DOGE, BNB or AVAX.
2. Add "PULSE Trend" to the chart. The defaults are ready to use; you do not need to change anything.
3. Optional: create an alert on this strategy and choose "Order fills and alert() function calls". You will get a message for every buy and exit on this chart AND on all 26 coins of the bundle (see below), from a single alert.
The dashboard in the top-right corner shows what the strategy is doing right now on this chart (Watching, In position, Below trend) and the live status of the 26-coin bundle.
--------------------------------------------------
WHICH COINS AND WHICH TIMEFRAME
--------------------------------------------------
- Timeframe: 2H is the base timeframe. All rules were designed and tested on 2H candles. The dashboard shows "2H ✓" when you are on the right timeframe. On other timeframes the windows are converted to the same number of days, but results will differ from the 2H base.
- Coins: large, liquid crypto pairs that trend well. Tested on BTC, ETH, SOL, XRP, DOGE, BNB and AVAX.
- History: the trend filter needs about 100 days of data before the first trade. New listings with short history will show no signals at first.
- Use one chart per coin. Running the strategy on several coins at once spreads risk across different trends.
--------------------------------------------------
26-COIN BUNDLE (MULTI-COIN SIMULATION + ALERTS)
--------------------------------------------------
TradingView strategies can only place orders on the chart symbol, so the strategy report always shows one coin. Trend following works best across many coins at once, because only a few coins trend strongly at any time. To show this, the script also runs the same rules on a fixed basket of 26 OKX USDT perpetuals, on 2H data, inside the script:
BTC, BNB, SOL, XRP, DOGE, AVAX, XAU (gold), XAG (silver), ONDO, PENGU, NEAR, SUI, ADA, XLM, PEPE, FLOKI, DASH, SEI, VVV, ETHFI, IOST, ONE, GALA, H, DOOD, POPCAT.
- Gold and silver use their own window lengths; all crypto coins share the crypto rules.
- All 26 coins share one capital pool: risk 2% per trade, total margin cap 50%, auto leverage up to 10x, compounding, 0.05% fee per side.
- The dashboard shows the bundle result (net profit, max drawdown, trades, win rate, profit factor, coins held) and a grid of all 26 coins: blue/red = in position with open P&L, gold = watching with distance to breakout, gray = below trend.
- Bundle alerts fire at the 2H bar close for every simulated buy and exit (coin, price, leverage, stop).
- This is a simulation calculated by the script, not the TradingView strategy report. It covers only the history your chart loads (on 2H usually from about 2022). It runs on 2H or lower charts.
Bundle result on the published chart (simulation, 2022-01 to 2026-11, settings above): net profit +4,071%, max drawdown 33.5%, 491 trades, win rate 44%, profit factor 2.31. Higher leverage and many coins at once also mean larger drawdowns.
--------------------------------------------------
HOW IT WORKS
--------------------------------------------------
1) Trend filter
A long-term trend line (an EMA covering about 100 days) must be below the price. Below the trend line the strategy does nothing and the candles turn gray.
2) Entry: breakout
When the trend filter is on, a gold breakout line is drawn at the highest high of roughly the last 30 days. A buy stop order sits on that line, so the entry fills the moment price breaks it (intrabar), not at the bar close.
3) Exit: trailing stop
A red trailing stop is placed several ATRs below the highest price since entry. It only moves up. When price touches it, the position is closed. There is no fixed take-profit; the trend decides when the trade ends.
4) Position size (risk-based)
The size is calculated so that a stop-out costs a fixed % of your capital ("Risk per trade"). Wide stop = smaller position, tight stop = larger position.
--------------------------------------------------
DEFAULT SETTINGS (used for the published report)
--------------------------------------------------
Inputs
- Risk per trade: 5% of capital at the initial stop
- Margin cap: 50% of capital per position
- Leverage: 1x (isolated). Optional "Auto leverage" picks leverage from the stop distance so the liquidation price stays 1.5x farther than the stop.
- Compounding: ON, reinvest 100% of realized profit and loss (after fees)
Properties
- Initial capital: 10,000 USDT
- Commission: 0.05% per side (typical taker fee for crypto perpetuals)
- Slippage: 2 ticks
- Margin for long positions: 2% (the script controls the actual leverage; see the Leverage input)
--------------------------------------------------
BACKTEST RESULTS (realistic costs, not a promise)
--------------------------------------------------
Published chart: OKX SOLUSDT perpetual, 2H, January 2022 to November 2026, default settings
- Net profit: +79.2%
- Max drawdown: 13.3%
- Trades: 32, win rate 53%, profit factor 2.43
Why fewer than 100 trades: this is a slow trend strategy that trades about 6 to 8 times per year on one coin. To check that the result is not luck, the same rules were tested on 7 coins (BTC, ETH, SOL, XRP, DOGE, BNB, AVAX) on Binance USDT perpetual 2H data from January 2020 to November 2026, with 0.05% fee per side and entries filled at the breakout level:
- 322 closed trades, win rate 46%
- Average win is about 4.3 times the average loss (in R)
- Every one of the 7 coins finished positive
Past results do not guarantee future results.
--------------------------------------------------
WHAT YOU SEE ON THE CHART
--------------------------------------------------
- Blue trend line with glow: the long-term trend. Blue shading above it, light red below it.
- Candles: blue/red while the trend is on, gray below the trend line.
- Gold line + price tag: the breakout line and the distance to it.
- Red line + price tag: the trailing stop while a trade is open, with a blue zone between price and stop.
- Result labels at exits: % result (after fees) and R (multiples of the initial risk). Hover a label to see entry, exit and leverage.
- Dashboard: this chart (state, breakout or stop, net profit, max drawdown, trades, win rate, profit factor, capital base) and the 26-coin bundle (results and coin grid).
- Text on/off: Settings → Inputs → "Chart text" hides all text on the chart at once (order names, result labels, price tags). Order names and price tags can also be turned off one by one. The quantity numbers next to order arrows come from TradingView and can be hidden in Settings → Style.
--------------------------------------------------
LIMITATIONS
--------------------------------------------------
- Long only. It does not short and stays flat in downtrends.
- Sideways markets produce several small losses in a row. Expect long flat periods between big trends.
- Intrabar entries: in live data a buy can fill and the bar can still close back below the line.
- The trailing stop is updated once per bar. Real fills can be worse during fast moves and gaps.
- Leverage above 1x increases the chance of liquidation. If the liquidation price is reached before the stop, the trade is closed as "Liquidated".
--------------------------------------------------
WHY CLOSED SOURCE
--------------------------------------------------
This strategy uses the same rule set and position sizing as our own automated trend engine, including the window lengths and trailing width selected through out-of-sample testing. The rule parameters are fixed so that the chart always matches the engine. Every step of the logic is explained above; only the exact numbers are kept private.
--------------------------------------------------
LANGUAGE
--------------------------------------------------
Settings → Inputs → Language: English or Korean (한국어). All labels and the dashboard switch language.
Korean UI terms: 26종목 묶음 = 26-coin bundle, 이 차트 = This chart, 보유 = Held, 매수 = Buy, 청산 = Exit, 강제 청산 = Liquidated, 돌파선 = Breakout line, 손절 = Stop, 추세선 = Trend line, 돌파 감시 중 = Watching, 보유 중 = In position, 추세선 아래 대기 = Below trend, 순수익 = Net profit, 최대 낙폭 = Max drawdown, 승률 = Win rate, 손익 배수 = Profit factor, 운용 자본 = Capital base, 복리 = Compounding, 비용 = Costs.
--------------------------------------------------
한국어 안내
--------------------------------------------------
PULSE Trend는 롱 전용 추세 추종 전략이에요. 횡보장에서는 쉬고, 장기 추세선 위에서 약 30일 박스를 뚫는 순간 들어가서, 위로만 올라가는 따라가기 손절로 추세를 끝까지 따라가요.
사용법
1. 2시간봉 차트를 열어요 (BTC, ETH, SOL, XRP, DOGE, BNB, AVAX 등 거래량 많은 USDT 무기한).
2. PULSE Trend를 차트에 넣어요. 기본값 그대로 바로 쓰면 돼요.
3. 알림: 얼러트 만들기 → 이 전략 → "주문 체결 및 alert() 함수 호출"을 고르면, 이 차트와 26종목 묶음의 매수·청산이 알람 하나로 다 와요.
26종목 묶음: 펄스 코인 24개 + 금·은을 펄스 방식(손절 2% · 증거금 한도 50% 공유 · 자동 레버리지 최대 10배 · 복리)으로 함께 굴린 시뮬레이션이에요. 상태판 아래쪽에 결과와 코인별 상태가 보여요. 트뷰 전략 리포트와는 따로 계산돼요.
차트 글자는 설정 → 인풋 → "차트 글자 전체"로 한 번에 켜고 끌 수 있어요.
기본 설정: 손절 한 번 5% · 증거금 한도 50% · 레버리지 1배 · 복리 100% · 수수료 편도 0.05% · 슬리피지 2틱
설정 → 인풋 → Language에서 한국어/영어를 바꿀 수 있어요.
과거 결과는 미래 수익을 보장하지 않아요.
--------------------------------------------------
QUICK START (3 steps)
--------------------------------------------------
1. Open a 2-hour (2H) chart of a liquid USDT perpetual pair, for example BTC, ETH, SOL, XRP, DOGE, BNB or AVAX.
2. Add "PULSE Trend" to the chart. The defaults are ready to use; you do not need to change anything.
3. Optional: create an alert on this strategy and choose "Order fills and alert() function calls". You will get a message for every buy and exit on this chart AND on all 26 coins of the bundle (see below), from a single alert.
The dashboard in the top-right corner shows what the strategy is doing right now on this chart (Watching, In position, Below trend) and the live status of the 26-coin bundle.
--------------------------------------------------
WHICH COINS AND WHICH TIMEFRAME
--------------------------------------------------
- Timeframe: 2H is the base timeframe. All rules were designed and tested on 2H candles. The dashboard shows "2H ✓" when you are on the right timeframe. On other timeframes the windows are converted to the same number of days, but results will differ from the 2H base.
- Coins: large, liquid crypto pairs that trend well. Tested on BTC, ETH, SOL, XRP, DOGE, BNB and AVAX.
- History: the trend filter needs about 100 days of data before the first trade. New listings with short history will show no signals at first.
- Use one chart per coin. Running the strategy on several coins at once spreads risk across different trends.
--------------------------------------------------
26-COIN BUNDLE (MULTI-COIN SIMULATION + ALERTS)
--------------------------------------------------
TradingView strategies can only place orders on the chart symbol, so the strategy report always shows one coin. Trend following works best across many coins at once, because only a few coins trend strongly at any time. To show this, the script also runs the same rules on a fixed basket of 26 OKX USDT perpetuals, on 2H data, inside the script:
BTC, BNB, SOL, XRP, DOGE, AVAX, XAU (gold), XAG (silver), ONDO, PENGU, NEAR, SUI, ADA, XLM, PEPE, FLOKI, DASH, SEI, VVV, ETHFI, IOST, ONE, GALA, H, DOOD, POPCAT.
- Gold and silver use their own window lengths; all crypto coins share the crypto rules.
- All 26 coins share one capital pool: risk 2% per trade, total margin cap 50%, auto leverage up to 10x, compounding, 0.05% fee per side.
- The dashboard shows the bundle result (net profit, max drawdown, trades, win rate, profit factor, coins held) and a grid of all 26 coins: blue/red = in position with open P&L, gold = watching with distance to breakout, gray = below trend.
- Bundle alerts fire at the 2H bar close for every simulated buy and exit (coin, price, leverage, stop).
- This is a simulation calculated by the script, not the TradingView strategy report. It covers only the history your chart loads (on 2H usually from about 2022). It runs on 2H or lower charts.
Bundle result on the published chart (simulation, 2022-01 to 2026-11, settings above): net profit +4,071%, max drawdown 33.5%, 491 trades, win rate 44%, profit factor 2.31. Higher leverage and many coins at once also mean larger drawdowns.
--------------------------------------------------
HOW IT WORKS
--------------------------------------------------
1) Trend filter
A long-term trend line (an EMA covering about 100 days) must be below the price. Below the trend line the strategy does nothing and the candles turn gray.
2) Entry: breakout
When the trend filter is on, a gold breakout line is drawn at the highest high of roughly the last 30 days. A buy stop order sits on that line, so the entry fills the moment price breaks it (intrabar), not at the bar close.
3) Exit: trailing stop
A red trailing stop is placed several ATRs below the highest price since entry. It only moves up. When price touches it, the position is closed. There is no fixed take-profit; the trend decides when the trade ends.
4) Position size (risk-based)
The size is calculated so that a stop-out costs a fixed % of your capital ("Risk per trade"). Wide stop = smaller position, tight stop = larger position.
--------------------------------------------------
DEFAULT SETTINGS (used for the published report)
--------------------------------------------------
Inputs
- Risk per trade: 5% of capital at the initial stop
- Margin cap: 50% of capital per position
- Leverage: 1x (isolated). Optional "Auto leverage" picks leverage from the stop distance so the liquidation price stays 1.5x farther than the stop.
- Compounding: ON, reinvest 100% of realized profit and loss (after fees)
Properties
- Initial capital: 10,000 USDT
- Commission: 0.05% per side (typical taker fee for crypto perpetuals)
- Slippage: 2 ticks
- Margin for long positions: 2% (the script controls the actual leverage; see the Leverage input)
--------------------------------------------------
BACKTEST RESULTS (realistic costs, not a promise)
--------------------------------------------------
Published chart: OKX SOLUSDT perpetual, 2H, January 2022 to November 2026, default settings
- Net profit: +79.2%
- Max drawdown: 13.3%
- Trades: 32, win rate 53%, profit factor 2.43
Why fewer than 100 trades: this is a slow trend strategy that trades about 6 to 8 times per year on one coin. To check that the result is not luck, the same rules were tested on 7 coins (BTC, ETH, SOL, XRP, DOGE, BNB, AVAX) on Binance USDT perpetual 2H data from January 2020 to November 2026, with 0.05% fee per side and entries filled at the breakout level:
- 322 closed trades, win rate 46%
- Average win is about 4.3 times the average loss (in R)
- Every one of the 7 coins finished positive
Past results do not guarantee future results.
--------------------------------------------------
WHAT YOU SEE ON THE CHART
--------------------------------------------------
- Blue trend line with glow: the long-term trend. Blue shading above it, light red below it.
- Candles: blue/red while the trend is on, gray below the trend line.
- Gold line + price tag: the breakout line and the distance to it.
- Red line + price tag: the trailing stop while a trade is open, with a blue zone between price and stop.
- Result labels at exits: % result (after fees) and R (multiples of the initial risk). Hover a label to see entry, exit and leverage.
- Dashboard: this chart (state, breakout or stop, net profit, max drawdown, trades, win rate, profit factor, capital base) and the 26-coin bundle (results and coin grid).
- Text on/off: Settings → Inputs → "Chart text" hides all text on the chart at once (order names, result labels, price tags). Order names and price tags can also be turned off one by one. The quantity numbers next to order arrows come from TradingView and can be hidden in Settings → Style.
--------------------------------------------------
LIMITATIONS
--------------------------------------------------
- Long only. It does not short and stays flat in downtrends.
- Sideways markets produce several small losses in a row. Expect long flat periods between big trends.
- Intrabar entries: in live data a buy can fill and the bar can still close back below the line.
- The trailing stop is updated once per bar. Real fills can be worse during fast moves and gaps.
- Leverage above 1x increases the chance of liquidation. If the liquidation price is reached before the stop, the trade is closed as "Liquidated".
--------------------------------------------------
WHY CLOSED SOURCE
--------------------------------------------------
This strategy uses the same rule set and position sizing as our own automated trend engine, including the window lengths and trailing width selected through out-of-sample testing. The rule parameters are fixed so that the chart always matches the engine. Every step of the logic is explained above; only the exact numbers are kept private.
--------------------------------------------------
LANGUAGE
--------------------------------------------------
Settings → Inputs → Language: English or Korean (한국어). All labels and the dashboard switch language.
Korean UI terms: 26종목 묶음 = 26-coin bundle, 이 차트 = This chart, 보유 = Held, 매수 = Buy, 청산 = Exit, 강제 청산 = Liquidated, 돌파선 = Breakout line, 손절 = Stop, 추세선 = Trend line, 돌파 감시 중 = Watching, 보유 중 = In position, 추세선 아래 대기 = Below trend, 순수익 = Net profit, 최대 낙폭 = Max drawdown, 승률 = Win rate, 손익 배수 = Profit factor, 운용 자본 = Capital base, 복리 = Compounding, 비용 = Costs.
--------------------------------------------------
한국어 안내
--------------------------------------------------
PULSE Trend는 롱 전용 추세 추종 전략이에요. 횡보장에서는 쉬고, 장기 추세선 위에서 약 30일 박스를 뚫는 순간 들어가서, 위로만 올라가는 따라가기 손절로 추세를 끝까지 따라가요.
사용법
1. 2시간봉 차트를 열어요 (BTC, ETH, SOL, XRP, DOGE, BNB, AVAX 등 거래량 많은 USDT 무기한).
2. PULSE Trend를 차트에 넣어요. 기본값 그대로 바로 쓰면 돼요.
3. 알림: 얼러트 만들기 → 이 전략 → "주문 체결 및 alert() 함수 호출"을 고르면, 이 차트와 26종목 묶음의 매수·청산이 알람 하나로 다 와요.
26종목 묶음: 펄스 코인 24개 + 금·은을 펄스 방식(손절 2% · 증거금 한도 50% 공유 · 자동 레버리지 최대 10배 · 복리)으로 함께 굴린 시뮬레이션이에요. 상태판 아래쪽에 결과와 코인별 상태가 보여요. 트뷰 전략 리포트와는 따로 계산돼요.
차트 글자는 설정 → 인풋 → "차트 글자 전체"로 한 번에 켜고 끌 수 있어요.
기본 설정: 손절 한 번 5% · 증거금 한도 50% · 레버리지 1배 · 복리 100% · 수수료 편도 0.05% · 슬리피지 2틱
설정 → 인풋 → Language에서 한국어/영어를 바꿀 수 있어요.
과거 결과는 미래 수익을 보장하지 않아요.
Release Note
Update: defaults now match the PULSE AI Trend engine.- Risk per trade: 2% (was 5%). Leverage: auto, max 10x (was fixed 1x). Margin cap: 50%.
- New input "Sizing mode": Risk % (PULSE, default) or Margin x Leverage. In Risk % mode the position size comes from the stop distance, so changing leverage only changes the margin, not the P&L. In Margin x Leverage mode, margin % x leverage goes into each trade, so higher leverage means larger P&L and larger drawdown.
- Liquidation is now also simulated in the 26-coin bundle when leverage is high.
- Default language is English (Inputs → Language → 한국어 for Korean). Input tooltips are in English.
Published chart with the new defaults (OKX SOLUSDT.P, 2H, 2022-01 to 2026-11, fee 0.05% per side + 2 ticks slippage): net profit +34.7%, max drawdown 5.5%, 32 trades, win rate 53%, profit factor 2.87. 26-coin bundle simulation with the same chart history: +4,071%, max drawdown 33.5%, 491 trades, win rate 44%. Past results do not guarantee future results.
Release Note
Fix: on charts below 2H (for example 15m or 5m) the script stopped with a runtime error because the 100-day trend line needed more than 5,000 bars of history. The trend line is now calculated without a lookback limit, so the dashboard and the 26-coin bundle also work on lower timeframes. Results on the 2H chart are unchanged (net +34.7%, max drawdown 5.5%, 32 trades). Lower timeframes load a shorter history, so their statistics cover a shorter period; 2H remains the recommended timeframe.
PULSE Scale | Run PULSE Trend 24/7 on 26 coins, fully automated on OKX. Free trial · English / 한국어. Questions & setup: pulsescale.io · support@pulsescale.io
คำจำกัดสิทธิ์ความรับผิดชอบ
ข้อมูลและบทความไม่ได้มีวัตถุประสงค์เพื่อก่อให้เกิดกิจกรรมทางการเงิน, การลงทุน, การซื้อขาย, ข้อเสนอแนะ หรือคำแนะนำประเภทอื่น ๆ ที่ให้หรือรับรองโดย TradingView อ่านเพิ่มเติมใน ข้อกำหนดการใช้งาน
PULSE Scale | Run PULSE Trend 24/7 on 26 coins, fully automated on OKX. Free trial · English / 한국어. Questions & setup: pulsescale.io · support@pulsescale.io
คำจำกัดสิทธิ์ความรับผิดชอบ
ข้อมูลและบทความไม่ได้มีวัตถุประสงค์เพื่อก่อให้เกิดกิจกรรมทางการเงิน, การลงทุน, การซื้อขาย, ข้อเสนอแนะ หรือคำแนะนำประเภทอื่น ๆ ที่ให้หรือรับรองโดย TradingView อ่านเพิ่มเติมใน ข้อกำหนดการใช้งาน