ที่อัปเดต:
My script
Implied Volatility vs Historical Volatility
**Uncheck Plot box**
**Uncheck Plot box**
- IV > HV = Overvalued
- IV = HV = Fair Value
- IV > HV = Undervalued
- 1. Pair with IV Rank: Use IV vs HV to confirm the setup, but IV Rank (50+, 70+) tells you how “high” IV is relative to its own history.
- 2. Timeframe: Use daily charts — IV is not meaningful on intraday timeframes.
- 3. Avoid noise: Use a smoothed HV (e.g., 20-day) and don’t chase small crossovers — look for clear divergence.
Release Note
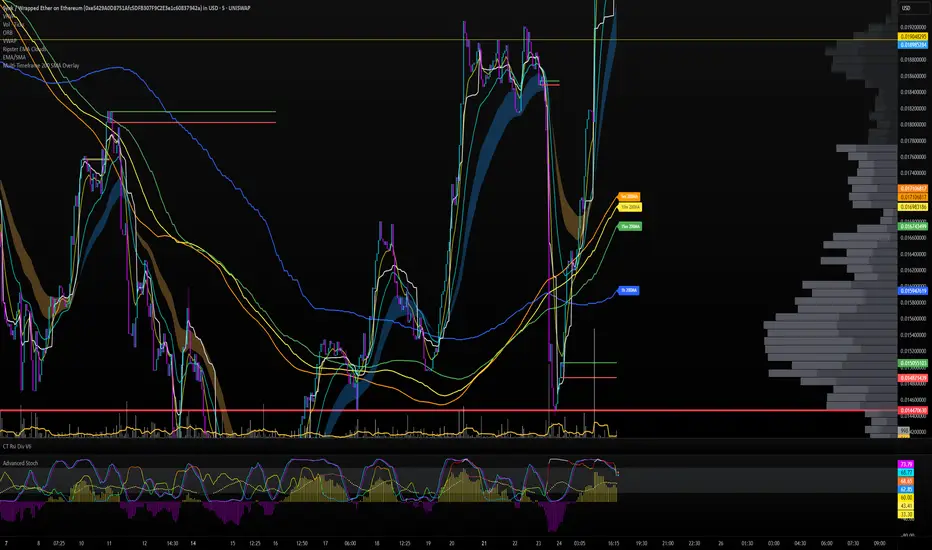
The Essential 200 MAs to watch in your day trading: 200 simple moving average for:5 minute
10 minute
15 minute
1 hour

คำจำกัดสิทธิ์ความรับผิดชอบ
ข้อมูลและบทความไม่ได้มีวัตถุประสงค์เพื่อก่อให้เกิดกิจกรรมทางการเงิน, การลงทุน, การซื้อขาย, ข้อเสนอแนะ หรือคำแนะนำประเภทอื่น ๆ ที่ให้หรือรับรองโดย TradingView อ่านเพิ่มเติมใน ข้อกำหนดการใช้งาน
คำจำกัดสิทธิ์ความรับผิดชอบ
ข้อมูลและบทความไม่ได้มีวัตถุประสงค์เพื่อก่อให้เกิดกิจกรรมทางการเงิน, การลงทุน, การซื้อขาย, ข้อเสนอแนะ หรือคำแนะนำประเภทอื่น ๆ ที่ให้หรือรับรองโดย TradingView อ่านเพิ่มเติมใน ข้อกำหนดการใช้งาน