ที่อัปเดต:
EMA30 Band Breakout v2 by EL COBER
EMA30 Band Breakout + HTF Supertrend Filter
Overview
This indicator builds a band from the EMA of the highs and the EMA of the lows (default length 30) and looks for breakouts of the swing extremes formed outside that band. A higher-timeframe Supertrend acts as a direction filter to cut down noise, especially counter-trend signals.
How it works
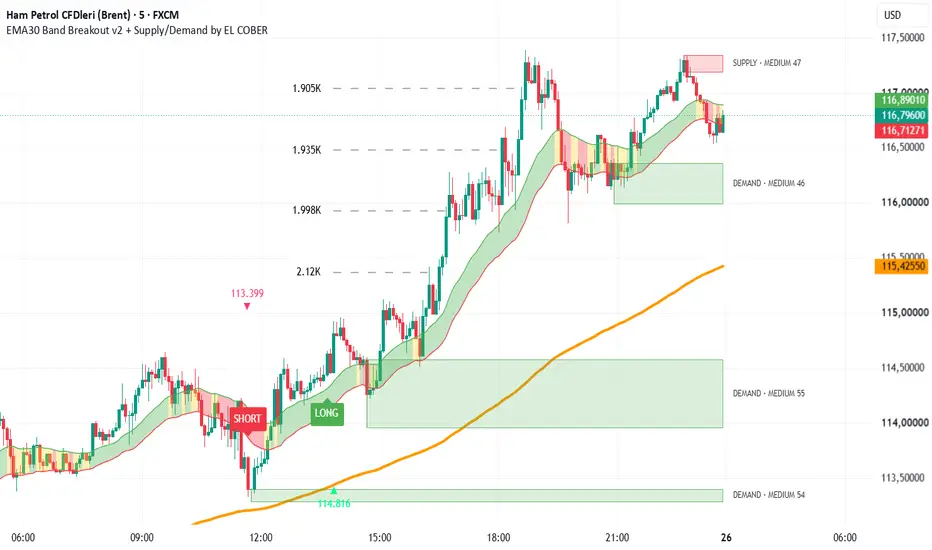
EMA30 High/Low band. The area between the two EMAs is shaded by price position: green when price closes above the band, red when it closes below, yellow when it is inside.
Peak/trough tracking. While price closes above the band, the highest high is tracked. When price returns inside the band, that value is stored as the previous peak. The same logic applies to the previous trough on the downside.
LONG signal. Price breaks above the previous peak (by close, or by high if you disable close confirmation) while above the EMA200.
SHORT signal. The mirror image: a break below the previous trough while below the EMA200.
Reversal signal. After a LONG, a set number of consecutive closes below the band (default 2) flips to SHORT. After a SHORT, the same number of closes above the band flips to LONG.
Alternating signals. Signals always alternate (LONG, SHORT, LONG...), so the same label is never repeated.
HTF Supertrend filter (the noise reducer)
The Supertrend is calculated on a higher timeframe and is not drawn on the chart. It is used only as a filter:
HTF Supertrend below price (uptrend): SHORT signals are suppressed.
HTF Supertrend above price (downtrend): LONG signals are suppressed.
The higher timeframe is picked automatically as the next one up from your chart (for example 5m chart → 15m), or you can set it manually. A blocked signal is discarded completely, so the LONG/SHORT sequence stays consistent.
Credits
The Supertrend calculation and the automatic higher-timeframe logic are based on the Supertrend script by Kıvanç Özbilgiç (KivancOzbilgic). Many thanks to him for sharing his work. The Supertrend concept itself is originally credited to Olivier Seban.
Settings
EMA band length, EMA200 trend length and the on/off trend filter
Close confirmation vs. high/low breakout
Reversal signal on/off and number of consecutive closes
Band fill colors and opacity, optional EMA50
HTF Supertrend: on/off, auto or manual timeframe, ATR period, multiplier, source
Notes
Higher-timeframe data can change on the live bar, so a signal may appear and disappear before the bar closes. Evaluate signals on bar close.
Works on any market and timeframe, but settings should be tested for your instrument.
This is a visual analysis tool, not financial advice. Past signals do not guarantee future results.
Overview
This indicator builds a band from the EMA of the highs and the EMA of the lows (default length 30) and looks for breakouts of the swing extremes formed outside that band. A higher-timeframe Supertrend acts as a direction filter to cut down noise, especially counter-trend signals.
How it works
EMA30 High/Low band. The area between the two EMAs is shaded by price position: green when price closes above the band, red when it closes below, yellow when it is inside.
Peak/trough tracking. While price closes above the band, the highest high is tracked. When price returns inside the band, that value is stored as the previous peak. The same logic applies to the previous trough on the downside.
LONG signal. Price breaks above the previous peak (by close, or by high if you disable close confirmation) while above the EMA200.
SHORT signal. The mirror image: a break below the previous trough while below the EMA200.
Reversal signal. After a LONG, a set number of consecutive closes below the band (default 2) flips to SHORT. After a SHORT, the same number of closes above the band flips to LONG.
Alternating signals. Signals always alternate (LONG, SHORT, LONG...), so the same label is never repeated.
HTF Supertrend filter (the noise reducer)
The Supertrend is calculated on a higher timeframe and is not drawn on the chart. It is used only as a filter:
HTF Supertrend below price (uptrend): SHORT signals are suppressed.
HTF Supertrend above price (downtrend): LONG signals are suppressed.
The higher timeframe is picked automatically as the next one up from your chart (for example 5m chart → 15m), or you can set it manually. A blocked signal is discarded completely, so the LONG/SHORT sequence stays consistent.
Credits
The Supertrend calculation and the automatic higher-timeframe logic are based on the Supertrend script by Kıvanç Özbilgiç (KivancOzbilgic). Many thanks to him for sharing his work. The Supertrend concept itself is originally credited to Olivier Seban.
Settings
EMA band length, EMA200 trend length and the on/off trend filter
Close confirmation vs. high/low breakout
Reversal signal on/off and number of consecutive closes
Band fill colors and opacity, optional EMA50
HTF Supertrend: on/off, auto or manual timeframe, ATR period, multiplier, source
Notes
Higher-timeframe data can change on the live bar, so a signal may appear and disappear before the bar closes. Evaluate signals on bar close.
Works on any market and timeframe, but settings should be tested for your instrument.
This is a visual analysis tool, not financial advice. Past signals do not guarantee future results.
Release Note
EMA30 Band Breakout v2 + Supply/Demand by EL COBEROverview
This indicator combines three tools into a single, clean chart layout: an EMA30 high/low band breakout system, Supply & Demand zones with a strength score, and Supertrend Extensions. Every module can be switched on or off from one “Aç/Kapa” (Toggle) group at the top of the settings, so you can build the chart view that fits your style.
What’s included
EMA30 Band Breakout
An EMA band built from the EMA30 of highs and lows, colored by price position (above, inside, below).
LONG/SHORT labels are generated when price breaks the previous peak/trough made outside the band.
EMA200 trend filter and optional reversal signals after consecutive closes outside the band.
A hidden higher-timeframe Supertrend filter reduces noise: no SHORT signals in an HTF uptrend, no LONG signals in an HTF downtrend. The HTF period can be selected automatically (one step above the chart timeframe).
Supply & Demand Zones with Strength Score
Zones are detected from swing pivots and filtered by departure strength (ATR multiple), width, touch count, distance to opposing zones, and overlap with existing zones.
Each zone gets a 0–100 strength score based on volume, departure strength, and zone tightness, then is labeled STRONG, MEDIUM, or WEAK. Stronger zones are drawn more opaque.
Broken zones are removed automatically.
Supertrend Extensions
Trend flip signals, volume-based candle coloring, and numbered deviation levels projected from each flip.
When price crosses a level, it turns dashed and shows the volume of the crossing bar.
What’s new in this version
Supply/Demand zones and Supertrend Extensions are now embedded directly into the EMA30 Band Breakout script. No need to run three separate indicators.
New Aç/Kapa group with switches for: Supply/Demand (master), Supply only, Demand only, zone labels, strength score in labels, Supertrend Extensions (master), and deviation levels.
Zone label text color is now a separate setting (Supply and Demand), so labels stay readable on any chart theme.
Default max zone width set to 3 ATR for wider zone detection.
Inputs are organized into clear groups (S/D Zone, S/D Filters, S/D Strength Score, S/D Appearance, Supertrend Ext).
How to use
Use the EMA30 band and LONG/SHORT labels for direction and timing.
Use Supply/Demand zones as areas of interest for entries, targets, and invalidation. Higher-scored zones carry more weight.
Use Supertrend Extensions for trend context and projected targets. Turn off candle coloring and area fill if the chart feels crowded.
Turn off any module you don’t need from the “Aç/Kapa” group.
Credits
Supertrend Extensions is based on the open-source script “Supertrend Extensions [BOSWaves]” by BOSWaves. Huge thanks for sharing it with the community.
The HTF Supertrend filter uses the auto higher-timeframe logic from the Supertrend script by Kıvanç Özbilgiç. Many thanks for his work.
Disclaimer
This indicator is for educational and analytical purposes only and is not financial advice. Past behavior does not guarantee future results. Always use proper risk management.
Release Note
Cosmetic changesZone colors follow the standard convention: Supply is red, Demand is green (both fill and border).
Zone label text now has its own color setting (Supply and Demand), set to black by default. It is no longer tied to the border color, so labels stay clearly readable. If you use a dark chart theme, change these to white.
Labels can be shortened to just “SUPPLY” / “DEMAND”, or hidden completely, with the label toggles.
Inputs are organized into clear groups (S/D Zone, S/D Filters, S/D Strength Score, S/D Appearance, Supertrend Ext), and the Supertrend line is named “Supertrend Ext” in the style settings to avoid confusion with the hidden HTF Supertrend filter.
Release Note
cosmetic changesoptions are now english.
Enjoy!
Release Note
Added: Custom EMA (optional)A new "Custom EMA" group is now in the settings. It is unchecked by default, so your chart looks exactly as before until you turn it on. Tick the box, enter any length you like (for example 9, 21, 100 or 144) and pick a color. It can be used together with the existing EMA50 option.
Nothing else was changed: the EMA30 band, LONG/SHORT signals, HTF Supertrend filter, Supply/Demand zones and Supertrend Extensions work exactly as before. The toggle group at the top of the settings is called "Toggles".
Why is the source code protected?
This script is published as a protected (closed-source) indicator. It is not a single textbook formula: it is a combination of several parts that I designed and tuned to work together. These are the band breakout rules with peak/trough tracking, the reversal logic, the hidden HTF Supertrend filter, the Supply/Demand detection with its filtering and 0-100 strength score, and the Supertrend extension levels. How these parts are connected and filtered is my own work, and protecting the source keeps that implementation intact.
It is still completely free to use, with no limitations. Every module can be switched on or off, and all key parameters are available in the settings. The description and release notes explain what each part does and where its limits are, so you can evaluate the tool without reading the code. Where I built on other people's open-source work, the credits are listed in the description above.
This is an analysis tool for educational purposes, not financial advice. Always use proper risk management.

คำจำกัดสิทธิ์ความรับผิดชอบ
ข้อมูลและบทความไม่ได้มีวัตถุประสงค์เพื่อก่อให้เกิดกิจกรรมทางการเงิน, การลงทุน, การซื้อขาย, ข้อเสนอแนะ หรือคำแนะนำประเภทอื่น ๆ ที่ให้หรือรับรองโดย TradingView อ่านเพิ่มเติมใน ข้อกำหนดการใช้งาน
คำจำกัดสิทธิ์ความรับผิดชอบ
ข้อมูลและบทความไม่ได้มีวัตถุประสงค์เพื่อก่อให้เกิดกิจกรรมทางการเงิน, การลงทุน, การซื้อขาย, ข้อเสนอแนะ หรือคำแนะนำประเภทอื่น ๆ ที่ให้หรือรับรองโดย TradingView อ่านเพิ่มเติมใน ข้อกำหนดการใช้งาน