OPEN-SOURCE SCRIPT
ที่อัปเดต: SAR/ATR Trend-Extension Oscillator
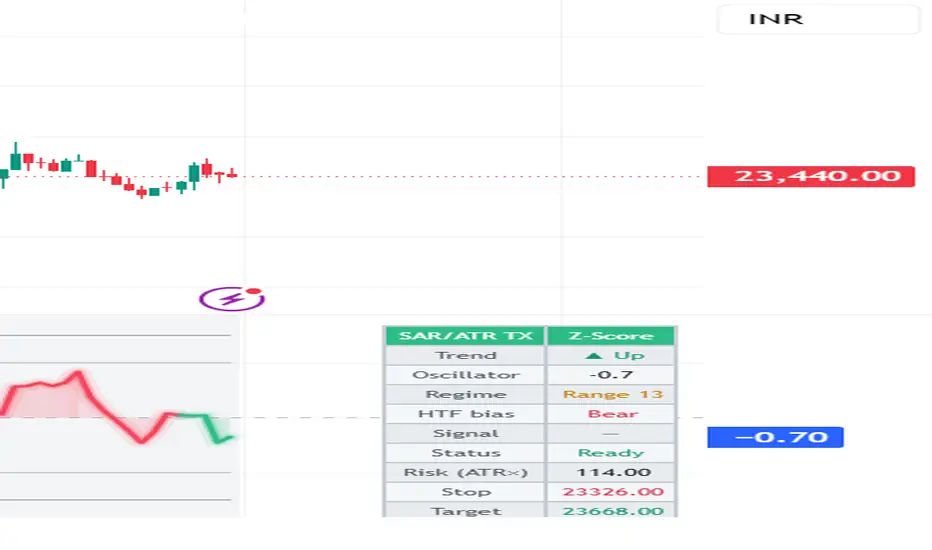
SAR/ATR Trend-Extension Oscillator
WHAT THIS INDICATOR IS
The SAR/ATR Trend-Extension Oscillator measures, in a single line, how far price has stretched away from its Parabolic SAR trailing reference, and it expresses that distance in units of volatility rather than raw price. The output is a signed oscillator: it rises into positive (green) territory as an uptrend extends and falls into negative (red) territory as a downtrend extends. The further the value sits from the zero line, the more stretched the current move is relative to its own recent volatility.
It is built as ONE coherent reading. Parabolic SAR and Average True Range (ATR) are not plotted side by side; they are fused mathematically into the oscillator value. Three further elements - a rolling statistical standardization, an ADX regime filter and a higher-timeframe trend filter - qualify and contextualize that value rather than adding separate indicators to the pane.
WHY THESE COMPONENTS ARE COMBINED (and how they work together)
Each ingredient is included to solve a specific weakness of the one before it.
1) Parabolic SAR provides trend direction and a trailing stop level, but on its own it only tells you which side of the trend you are on. The raw gap between price and SAR is measured in price points, which cannot be compared between a low-priced stock and a high-valued index, or between a quiet and a volatile session. So SAR alone cannot answer "how stretched is this move."
2) ATR answers that. By dividing the SAR-to-price gap by ATR, the distance becomes volatility-relative: "price is X average true ranges beyond its SAR." This SAR-divided-by-ATR step is the core of the indicator and produces information that neither Parabolic SAR nor ATR shows alone - a bounded, cross-market measure of trend extension that reads consistently across symbols and timeframes.
3) Rolling standardization (Z-Score, or robust median/MAD) fixes a subtler problem: even an ATR-normalized value has a distribution that drifts over time, so one fixed threshold means different things in different conditions. Standardizing the value over a lookback window rescales it so the +/-2 and +/-3 reference levels keep a stable statistical meaning. A "Raw" mode (the plain volatility-normalized value, no rescaling) is also available.
4) ADX regime filter. Parabolic SAR is prone to repeated false flips in sideways markets. ADX measures trend strength, so the indicator suppresses buy/sell flags whenever ADX is below a user threshold (a ranging market) and shades the background to show it. ADX is never drawn on the oscillator; it only gates the signals.
5) Higher-timeframe filter. The same SAR direction is read from a higher, confirmed timeframe and used to filter out crossings that fight the dominant trend. It is the identical calculation applied to a larger context, not a different indicator.
6) Divergence. Because the oscillator is a measure of trend extension, a price high paired with a lower oscillator high (or a price low paired with a higher oscillator low) indicates the trend is extending less forcefully. Regular and hidden divergences are detected from confirmed pivots and drawn with connecting lines and labels.
Putting it together, the plotted value is one number: sign(SAR trend) x (SAR-to-price gap / ATR), optionally standardized and clamped to limit single-bar spikes.
A buy or sell flag is raised only when that oscillator crosses the Signal level AND the ADX regime AND the higher-timeframe direction agree. Everything feeds one question: is price extending, in a genuine trend, in line with the larger trend?
WHAT MAKES IT ORIGINAL
This is not Parabolic SAR with an ATR drawn next to it. It transforms the SAR trailing stop into a continuous, signed, volatility-normalized and statistically standardized extension oscillator, then wraps that single value in regime and higher-timeframe gating plus divergence logic. The resulting "how stretched is this trend, on a comparable scale" reading does not exist in either source indicator.
HOW TO USE IT
- Choose a normalization mode: Raw, Z-Score, or Robust (median/MAD, least sensitive to spikes).
- Read color and distance: green = uptrend extension, red = downtrend extension; the further from zero, the more extended. The Signal, Warning and Extreme levels mark progressively stretched zones.
- Treat the triangle markers (a Signal-level cross that agrees with the ADX regime and the higher-timeframe bias) as points to investigate, not as automatic entries.
- Use divergences as early warning that extension is fading, and the on-pane dashboard for trend, regime, higher-timeframe bias and ATR-based stop/target context. The stop and target figures are reference levels only.
- All parameters - SAR step and maximum, ATR period and smoothing type, the standardization window, every threshold, the ADX threshold and the higher timeframe - are adjustable.
REPAINTING
Signals confirm on bar close by default and do not repaint. The higher-timeframe filter reads the previous closed higher-timeframe bar, so it does not look ahead. Divergence labels appear a few bars after the pivot they confirm; that lag is inherent to honest pivot detection and is expected behavior.
ATTRIBUTION
This implementation builds on the original concept of combining Parabolic SAR with ATR. The volatility normalization, statistical standardization, regime and higher-timeframe filtering, divergence detection and alerting described above are part of this independent implementation.
DISCLAIMER
This script is provided for research and educational purposes only. It is not financial advice and makes no guarantee of profitability or accuracy. Indicators describe past and present price behavior; they do not predict future prices, and no indicator works in all conditions. Trading involves substantial risk of loss. Always test on historical and out-of-sample data and make your own independent decisions. The author accepts no liability for any use of this script.
WHAT THIS INDICATOR IS
The SAR/ATR Trend-Extension Oscillator measures, in a single line, how far price has stretched away from its Parabolic SAR trailing reference, and it expresses that distance in units of volatility rather than raw price. The output is a signed oscillator: it rises into positive (green) territory as an uptrend extends and falls into negative (red) territory as a downtrend extends. The further the value sits from the zero line, the more stretched the current move is relative to its own recent volatility.
It is built as ONE coherent reading. Parabolic SAR and Average True Range (ATR) are not plotted side by side; they are fused mathematically into the oscillator value. Three further elements - a rolling statistical standardization, an ADX regime filter and a higher-timeframe trend filter - qualify and contextualize that value rather than adding separate indicators to the pane.
WHY THESE COMPONENTS ARE COMBINED (and how they work together)
Each ingredient is included to solve a specific weakness of the one before it.
1) Parabolic SAR provides trend direction and a trailing stop level, but on its own it only tells you which side of the trend you are on. The raw gap between price and SAR is measured in price points, which cannot be compared between a low-priced stock and a high-valued index, or between a quiet and a volatile session. So SAR alone cannot answer "how stretched is this move."
2) ATR answers that. By dividing the SAR-to-price gap by ATR, the distance becomes volatility-relative: "price is X average true ranges beyond its SAR." This SAR-divided-by-ATR step is the core of the indicator and produces information that neither Parabolic SAR nor ATR shows alone - a bounded, cross-market measure of trend extension that reads consistently across symbols and timeframes.
3) Rolling standardization (Z-Score, or robust median/MAD) fixes a subtler problem: even an ATR-normalized value has a distribution that drifts over time, so one fixed threshold means different things in different conditions. Standardizing the value over a lookback window rescales it so the +/-2 and +/-3 reference levels keep a stable statistical meaning. A "Raw" mode (the plain volatility-normalized value, no rescaling) is also available.
4) ADX regime filter. Parabolic SAR is prone to repeated false flips in sideways markets. ADX measures trend strength, so the indicator suppresses buy/sell flags whenever ADX is below a user threshold (a ranging market) and shades the background to show it. ADX is never drawn on the oscillator; it only gates the signals.
5) Higher-timeframe filter. The same SAR direction is read from a higher, confirmed timeframe and used to filter out crossings that fight the dominant trend. It is the identical calculation applied to a larger context, not a different indicator.
6) Divergence. Because the oscillator is a measure of trend extension, a price high paired with a lower oscillator high (or a price low paired with a higher oscillator low) indicates the trend is extending less forcefully. Regular and hidden divergences are detected from confirmed pivots and drawn with connecting lines and labels.
Putting it together, the plotted value is one number: sign(SAR trend) x (SAR-to-price gap / ATR), optionally standardized and clamped to limit single-bar spikes.
A buy or sell flag is raised only when that oscillator crosses the Signal level AND the ADX regime AND the higher-timeframe direction agree. Everything feeds one question: is price extending, in a genuine trend, in line with the larger trend?
WHAT MAKES IT ORIGINAL
This is not Parabolic SAR with an ATR drawn next to it. It transforms the SAR trailing stop into a continuous, signed, volatility-normalized and statistically standardized extension oscillator, then wraps that single value in regime and higher-timeframe gating plus divergence logic. The resulting "how stretched is this trend, on a comparable scale" reading does not exist in either source indicator.
HOW TO USE IT
- Choose a normalization mode: Raw, Z-Score, or Robust (median/MAD, least sensitive to spikes).
- Read color and distance: green = uptrend extension, red = downtrend extension; the further from zero, the more extended. The Signal, Warning and Extreme levels mark progressively stretched zones.
- Treat the triangle markers (a Signal-level cross that agrees with the ADX regime and the higher-timeframe bias) as points to investigate, not as automatic entries.
- Use divergences as early warning that extension is fading, and the on-pane dashboard for trend, regime, higher-timeframe bias and ATR-based stop/target context. The stop and target figures are reference levels only.
- All parameters - SAR step and maximum, ATR period and smoothing type, the standardization window, every threshold, the ADX threshold and the higher timeframe - are adjustable.
REPAINTING
Signals confirm on bar close by default and do not repaint. The higher-timeframe filter reads the previous closed higher-timeframe bar, so it does not look ahead. Divergence labels appear a few bars after the pivot they confirm; that lag is inherent to honest pivot detection and is expected behavior.
ATTRIBUTION
This implementation builds on the original concept of combining Parabolic SAR with ATR. The volatility normalization, statistical standardization, regime and higher-timeframe filtering, divergence detection and alerting described above are part of this independent implementation.
DISCLAIMER
This script is provided for research and educational purposes only. It is not financial advice and makes no guarantee of profitability or accuracy. Indicators describe past and present price behavior; they do not predict future prices, and no indicator works in all conditions. Trading involves substantial risk of loss. Always test on historical and out-of-sample data and make your own independent decisions. The author accepts no liability for any use of this script.
Release Note
Minor updatesRelease Note
minor update สคริปต์แบบโอเพนซอร์ส
ด้วยเจตนารมณ์หลักของ TradingView ผู้สร้างสคริปต์นี้ได้ทำให้เป็นโอเพนซอร์ส เพื่อให้เทรดเดอร์สามารถตรวจสอบและยืนยันฟังก์ชันการทำงานของมันได้ ขอชื่นชมผู้เขียน! แม้ว่าคุณจะใช้งานได้ฟรี แต่โปรดจำไว้ว่าการเผยแพร่โค้ดซ้ำจะต้องเป็นไปตาม กฎระเบียบการใช้งาน ของเรา

คำจำกัดสิทธิ์ความรับผิดชอบ
ข้อมูลและบทความไม่ได้มีวัตถุประสงค์เพื่อก่อให้เกิดกิจกรรมทางการเงิน, การลงทุน, การซื้อขาย, ข้อเสนอแนะ หรือคำแนะนำประเภทอื่น ๆ ที่ให้หรือรับรองโดย TradingView อ่านเพิ่มเติมใน ข้อกำหนดการใช้งาน
สคริปต์แบบโอเพนซอร์ส
ด้วยเจตนารมณ์หลักของ TradingView ผู้สร้างสคริปต์นี้ได้ทำให้เป็นโอเพนซอร์ส เพื่อให้เทรดเดอร์สามารถตรวจสอบและยืนยันฟังก์ชันการทำงานของมันได้ ขอชื่นชมผู้เขียน! แม้ว่าคุณจะใช้งานได้ฟรี แต่โปรดจำไว้ว่าการเผยแพร่โค้ดซ้ำจะต้องเป็นไปตาม กฎระเบียบการใช้งาน ของเรา
คำจำกัดสิทธิ์ความรับผิดชอบ
ข้อมูลและบทความไม่ได้มีวัตถุประสงค์เพื่อก่อให้เกิดกิจกรรมทางการเงิน, การลงทุน, การซื้อขาย, ข้อเสนอแนะ หรือคำแนะนำประเภทอื่น ๆ ที่ให้หรือรับรองโดย TradingView อ่านเพิ่มเติมใน ข้อกำหนดการใช้งาน