Pattern Structure Pro
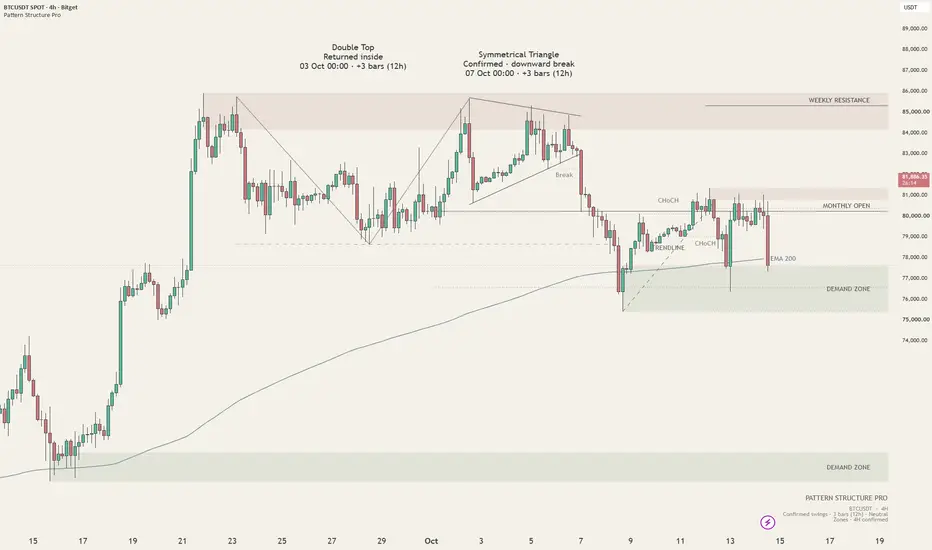
Pattern Structure Pro is an open-source chart overlay for patterns, market structure and price context.
It displays tops/bottoms, head-and-shoulders formations, triangles, wedges, flags, pennants, channels and rectangles. Additional layers include swing labels, BOS/CHoCH, a swing trendline, supply/demand zones, weekly/monthly reference levels and optional EMA 200. Up to three selected patterns are shown.
The engine compares pivot sequences and fitted boundaries using ATR-based tolerances. Pattern captions describe forming structures, boundary breaks or a return inside. Historical geometry appears after the required pivots have been detected. Recognition can miss formations or produce false positives.
Intended intervals: 1H, 2H, 4H and 1D. Patterns, structure and EMA use the chart interval. Zones use a shared 4H source by default; choose Chart for interval-specific zones.
Analysis is the default view, showing geometry, states and timing. Stories uses compact annotations and fewer context layers. All major layers can be toggled in settings.
Released under the MIT License. Everyone is welcome to inspect the source, suggest improvements and contribute. This is a chart-analysis tool, not a trade recommendation.
It displays tops/bottoms, head-and-shoulders formations, triangles, wedges, flags, pennants, channels and rectangles. Additional layers include swing labels, BOS/CHoCH, a swing trendline, supply/demand zones, weekly/monthly reference levels and optional EMA 200. Up to three selected patterns are shown.
The engine compares pivot sequences and fitted boundaries using ATR-based tolerances. Pattern captions describe forming structures, boundary breaks or a return inside. Historical geometry appears after the required pivots have been detected. Recognition can miss formations or produce false positives.
Intended intervals: 1H, 2H, 4H and 1D. Patterns, structure and EMA use the chart interval. Zones use a shared 4H source by default; choose Chart for interval-specific zones.
Analysis is the default view, showing geometry, states and timing. Stories uses compact annotations and fewer context layers. All major layers can be toggled in settings.
Released under the MIT License. Everyone is welcome to inspect the source, suggest improvements and contribute. This is a chart-analysis tool, not a trade recommendation.

คำจำกัดสิทธิ์ความรับผิดชอบ
ข้อมูลและบทความไม่ได้มีวัตถุประสงค์เพื่อก่อให้เกิดกิจกรรมทางการเงิน, การลงทุน, การซื้อขาย, ข้อเสนอแนะ หรือคำแนะนำประเภทอื่น ๆ ที่ให้หรือรับรองโดย TradingView อ่านเพิ่มเติมใน ข้อกำหนดการใช้งาน
คำจำกัดสิทธิ์ความรับผิดชอบ
ข้อมูลและบทความไม่ได้มีวัตถุประสงค์เพื่อก่อให้เกิดกิจกรรมทางการเงิน, การลงทุน, การซื้อขาย, ข้อเสนอแนะ หรือคำแนะนำประเภทอื่น ๆ ที่ให้หรือรับรองโดย TradingView อ่านเพิ่มเติมใน ข้อกำหนดการใช้งาน