ATK/DEF Major Structure Dynamics
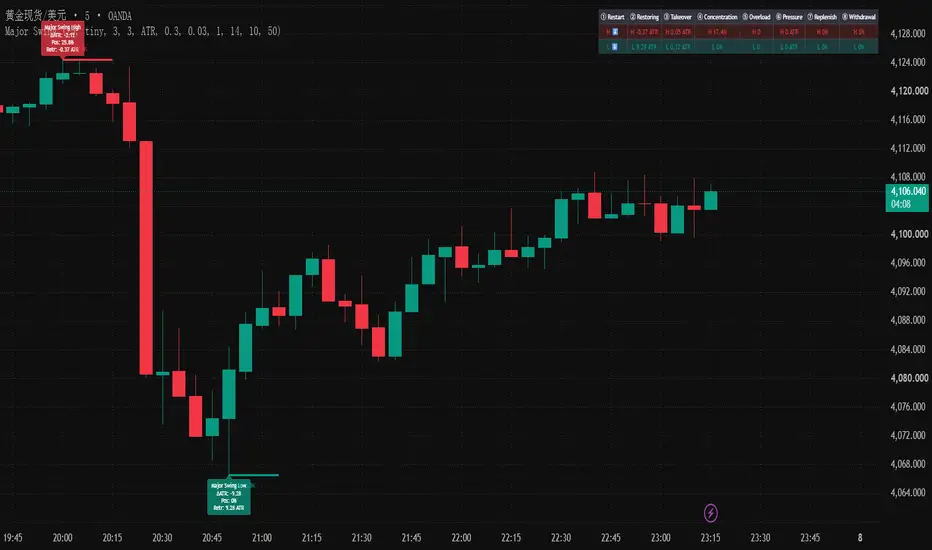
ATK/DEF Major Structure Dynamics is a major-scale market structure observation framework built around Major Swing High / Low.
The framework focuses on the structural behavior of Major Swings across a defined reference window, with eight core dimensions describing the progression of the current Major structure.
## Major Swing Structure
Major Swing High and Major Swing Low are generated from a configurable Pivot Length.
Each Major Swing records its structural position and subsequent interaction, including:
* Major Swing High
* Major Swing Low
* ATR reference
* Position
* Retracement
* Volume
* Touch count
* Structural break
* Post-break extension
* Structural return
The framework maintains separate Major High and Major Low records and tracks their structural changes over time.
## Major Structure Dynamics
The primary focus of the framework is the following eight structural dimensions:
### ① Restart
Records the direction of the oldest Swing within the reference window.
This identifies which side started the current Major structure.
### ② Restoring
Measures the distance from the current Major Swing to the previous opposite Major Swing, normalized by ATR.
A higher value represents a larger structural movement.
### ③ Takeover
Measures the movement speed of the most recent same-direction Major Swings, normalized by ATR.
A higher value represents greater relative movement intensity.
### ④ Concentration
Measures the current Major Swing's position within the reference range.
**0%** represents the low of the reference range, while **100%** represents the high.
### ⑤ Overload
Records how many times the current Major Swing level has been touched.
The value represents the accumulated structural interactions with the Major level.
### ⑥ Pressure
After the Major Swing is broken, measures how far price extends beyond the Major level, normalized by ATR.
The value represents the post-break extension from the original Major structure.
### ⑦ Replenish
When the Major Swing is broken and price subsequently returns, measures how much of the reference range is recovered.
### ⑧ Withdrawal
After the Major Swing is broken, measures how far price remains outside the original Major Swing level.
## Major Market Table
The market table organizes Major Swing High and Major Swing Low into the eight structural dimensions:
**Restart → Restoring → Takeover → Concentration → Overload → Pressure → Replenish → Withdrawal**
Separate **H / L** values are displayed for the corresponding Major Swing structures.
The table provides directional reference, ATR-normalized structural movement, movement intensity, reference-range position, touch count, post-break extension, recovery, and remaining displacement outside the Major level.
## Display
Configurable components include:
* Major Swing Pivot Length
* High / Low Display
* High / Low Colors
* ATR Length
* Deduplication Mode
* ATR / Percent / Points Reference
* ATR Deviation
* Position
* Retracement
* Volume
* Reference Swing Range
* Major Market Table
## Scope
For market observation and user-defined technical analysis only.
The framework focuses on the structural behavior of Major Swings across a defined reference window, with eight core dimensions describing the progression of the current Major structure.
## Major Swing Structure
Major Swing High and Major Swing Low are generated from a configurable Pivot Length.
Each Major Swing records its structural position and subsequent interaction, including:
* Major Swing High
* Major Swing Low
* ATR reference
* Position
* Retracement
* Volume
* Touch count
* Structural break
* Post-break extension
* Structural return
The framework maintains separate Major High and Major Low records and tracks their structural changes over time.
## Major Structure Dynamics
The primary focus of the framework is the following eight structural dimensions:
### ① Restart
Records the direction of the oldest Swing within the reference window.
This identifies which side started the current Major structure.
### ② Restoring
Measures the distance from the current Major Swing to the previous opposite Major Swing, normalized by ATR.
A higher value represents a larger structural movement.
### ③ Takeover
Measures the movement speed of the most recent same-direction Major Swings, normalized by ATR.
A higher value represents greater relative movement intensity.
### ④ Concentration
Measures the current Major Swing's position within the reference range.
**0%** represents the low of the reference range, while **100%** represents the high.
### ⑤ Overload
Records how many times the current Major Swing level has been touched.
The value represents the accumulated structural interactions with the Major level.
### ⑥ Pressure
After the Major Swing is broken, measures how far price extends beyond the Major level, normalized by ATR.
The value represents the post-break extension from the original Major structure.
### ⑦ Replenish
When the Major Swing is broken and price subsequently returns, measures how much of the reference range is recovered.
### ⑧ Withdrawal
After the Major Swing is broken, measures how far price remains outside the original Major Swing level.
## Major Market Table
The market table organizes Major Swing High and Major Swing Low into the eight structural dimensions:
**Restart → Restoring → Takeover → Concentration → Overload → Pressure → Replenish → Withdrawal**
Separate **H / L** values are displayed for the corresponding Major Swing structures.
The table provides directional reference, ATR-normalized structural movement, movement intensity, reference-range position, touch count, post-break extension, recovery, and remaining displacement outside the Major level.
## Display
Configurable components include:
* Major Swing Pivot Length
* High / Low Display
* High / Low Colors
* ATR Length
* Deduplication Mode
* ATR / Percent / Points Reference
* ATR Deviation
* Position
* Retracement
* Volume
* Reference Swing Range
* Major Market Table
## Scope
For market observation and user-defined technical analysis only.

คำจำกัดสิทธิ์ความรับผิดชอบ
ข้อมูลและบทความไม่ได้มีวัตถุประสงค์เพื่อก่อให้เกิดกิจกรรมทางการเงิน, การลงทุน, การซื้อขาย, ข้อเสนอแนะ หรือคำแนะนำประเภทอื่น ๆ ที่ให้หรือรับรองโดย TradingView อ่านเพิ่มเติมใน ข้อกำหนดการใช้งาน
คำจำกัดสิทธิ์ความรับผิดชอบ
ข้อมูลและบทความไม่ได้มีวัตถุประสงค์เพื่อก่อให้เกิดกิจกรรมทางการเงิน, การลงทุน, การซื้อขาย, ข้อเสนอแนะ หรือคำแนะนำประเภทอื่น ๆ ที่ให้หรือรับรองโดย TradingView อ่านเพิ่มเติมใน ข้อกำหนดการใช้งาน