OPEN-SOURCE SCRIPT
Nexus Global 15m ORB
Introduction
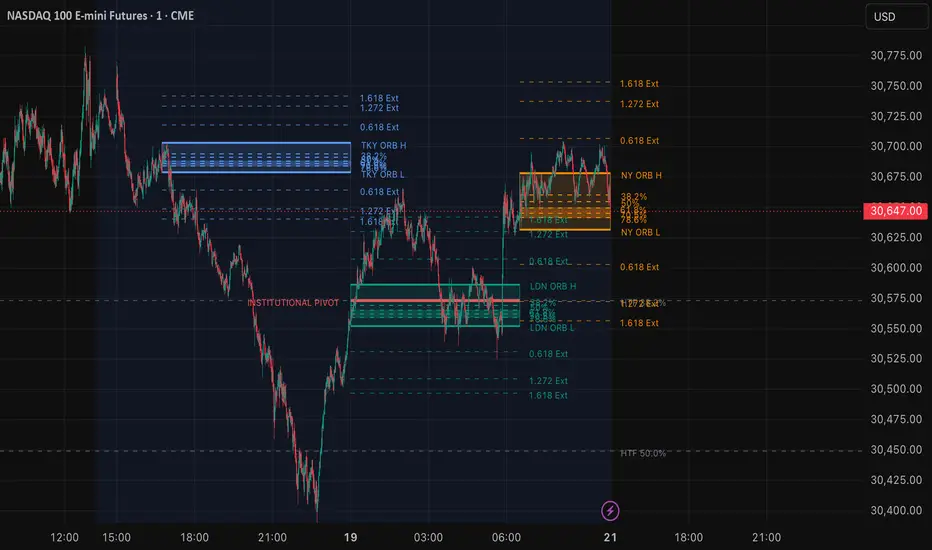
The Nexus Global 15m ORB indicator is a comprehensive opening range tool designed to map the initial 15-minute price action across the three major global trading sessions: Tokyo, London, and New York. Beyond simply marking the high and low of the opening range, this script integrates Fibonacci-based Optimal Trade Entry (OTE) zones, mathematical trend extensions, and Higher Timeframe (HTF) structural confluence to help traders identify high-probability reversal and continuation zones.
Core Concepts & What It Does
Opening Range Breakout (ORB) strategies rely on the volatility generated at the start of a trading session. The first 15 minutes often establish a support and resistance framework for the hours that follow. This indicator automatically detects these 15-minute windows and projects the range forward until the next session begins.
However, a standard ORB is often not enough to build a complete trading plan. To address this, the indicator incorporates:
- Internal Fibonacci Levels & OTE Zone: Calculates key retracement levels (38.2% and 50%) and highlights a specific Optimal Trade Entry (OTE) box between the 61.8% and 78.6% levels of the session's range.
- Session Trend Extensions: Projects standard Fibonacci extensions (0.618, 1.272, and 1.618) outward from the ORB high and low to serve as dynamic take-profit targets or exhaustion levels.
- HTF Institutional Pivots: Pulls structural swing highs and lows from a user-defined higher timeframe (e.g., 4-hour) and calculates its own macro Fibonacci levels. When these macro levels intersect with the micro 15m ORB range, the indicator highlights them as "Institutional Pivots."
How It Calculates (Underlying Logic)
- Session Tracking: Uses time() functions to detect the exact 15-minute timeframe of the Tokyo (0845-0900 JST), London (0800-0815 GMT), and New York (0930-0945 EST) opens. It dynamically tracks the high and low during this window and locks the values once the window closes.
- Internal Mathematics: The range size (rng) is calculated as ORB High - ORB Low. Internal levels are found by subtracting percentages of the range from the ORB High (e.g., ORB High - (rng * 0.5) for the 50% level).
- HTF Confluence: Utilizes request.security() alongside ta.highest() and ta.lowest() over a customizable lookback period to establish the macro structural range. It then checks if the macro 38.2%, 50%, or 61.8% levels fall sequentially inside the current active ORB boundaries, plotting them distinctly when true.
- Performance Optimization: To ensure the indicator does not cause chart lag (a common issue with heavy line/box drawing scripts), the drawing engine is restricted to update visual arrays strictly on barstate.islast, ensuring lightning-fast load times even on the 1-minute chart.*
How to Use It
- Breakout & Retest: Watch for price to break the ORB High or Low, and then wait for a retracement back to the 38.2% or 50% internal levels to join the trend toward the 1.272 or 1.618 extensions.
- OTE Reversals: If a false breakout (fake-out) occurs, look for price to return to the highlighted OTE Zone (61.8% - 78.6%). This zone often acts as a strong area of defense for institutional order flow, providing excellent risk-to-reward entries back toward the opposite side of the ORB.
- Institutional Pivots: When an HTF line populates inside the session range, treat it as a heavy magnet or resistance. Trades taken in confluence with these pivots carry a much higher structural weighting.
Originality & Usefulness
While there are many ORB tools on TradingView, the vast majority only display horizontal lines for the high and low. This script is highly original because it combines micro-session timing with macro-structural Fibonacci confluence. By mashing up session tracking with HTF swing analysis and deep optimization drawing methods, it provides a complete, lag-free institutional framework in a single indicator, saving traders from needing multiple overlapping scripts to achieve the same result.
The Nexus Global 15m ORB indicator is a comprehensive opening range tool designed to map the initial 15-minute price action across the three major global trading sessions: Tokyo, London, and New York. Beyond simply marking the high and low of the opening range, this script integrates Fibonacci-based Optimal Trade Entry (OTE) zones, mathematical trend extensions, and Higher Timeframe (HTF) structural confluence to help traders identify high-probability reversal and continuation zones.
Core Concepts & What It Does
Opening Range Breakout (ORB) strategies rely on the volatility generated at the start of a trading session. The first 15 minutes often establish a support and resistance framework for the hours that follow. This indicator automatically detects these 15-minute windows and projects the range forward until the next session begins.
However, a standard ORB is often not enough to build a complete trading plan. To address this, the indicator incorporates:
- Internal Fibonacci Levels & OTE Zone: Calculates key retracement levels (38.2% and 50%) and highlights a specific Optimal Trade Entry (OTE) box between the 61.8% and 78.6% levels of the session's range.
- Session Trend Extensions: Projects standard Fibonacci extensions (0.618, 1.272, and 1.618) outward from the ORB high and low to serve as dynamic take-profit targets or exhaustion levels.
- HTF Institutional Pivots: Pulls structural swing highs and lows from a user-defined higher timeframe (e.g., 4-hour) and calculates its own macro Fibonacci levels. When these macro levels intersect with the micro 15m ORB range, the indicator highlights them as "Institutional Pivots."
How It Calculates (Underlying Logic)
- Session Tracking: Uses time() functions to detect the exact 15-minute timeframe of the Tokyo (0845-0900 JST), London (0800-0815 GMT), and New York (0930-0945 EST) opens. It dynamically tracks the high and low during this window and locks the values once the window closes.
- Internal Mathematics: The range size (rng) is calculated as ORB High - ORB Low. Internal levels are found by subtracting percentages of the range from the ORB High (e.g., ORB High - (rng * 0.5) for the 50% level).
- HTF Confluence: Utilizes request.security() alongside ta.highest() and ta.lowest() over a customizable lookback period to establish the macro structural range. It then checks if the macro 38.2%, 50%, or 61.8% levels fall sequentially inside the current active ORB boundaries, plotting them distinctly when true.
- Performance Optimization: To ensure the indicator does not cause chart lag (a common issue with heavy line/box drawing scripts), the drawing engine is restricted to update visual arrays strictly on barstate.islast, ensuring lightning-fast load times even on the 1-minute chart.*
How to Use It
- Breakout & Retest: Watch for price to break the ORB High or Low, and then wait for a retracement back to the 38.2% or 50% internal levels to join the trend toward the 1.272 or 1.618 extensions.
- OTE Reversals: If a false breakout (fake-out) occurs, look for price to return to the highlighted OTE Zone (61.8% - 78.6%). This zone often acts as a strong area of defense for institutional order flow, providing excellent risk-to-reward entries back toward the opposite side of the ORB.
- Institutional Pivots: When an HTF line populates inside the session range, treat it as a heavy magnet or resistance. Trades taken in confluence with these pivots carry a much higher structural weighting.
Originality & Usefulness
While there are many ORB tools on TradingView, the vast majority only display horizontal lines for the high and low. This script is highly original because it combines micro-session timing with macro-structural Fibonacci confluence. By mashing up session tracking with HTF swing analysis and deep optimization drawing methods, it provides a complete, lag-free institutional framework in a single indicator, saving traders from needing multiple overlapping scripts to achieve the same result.
สคริปต์โอเพนซอร์ซ
ด้วยเจตนารมณ์หลักของ TradingView ผู้สร้างสคริปต์นี้ได้ทำให้เป็นโอเพนซอร์ส เพื่อให้เทรดเดอร์สามารถตรวจสอบและยืนยันฟังก์ชันการทำงานของมันได้ ขอชื่นชมผู้เขียน! แม้ว่าคุณจะใช้งานได้ฟรี แต่โปรดจำไว้ว่าการเผยแพร่โค้ดซ้ำจะต้องเป็นไปตาม กฎระเบียบการใช้งาน ของเรา

คำจำกัดสิทธิ์ความรับผิดชอบ
ข้อมูลและบทความไม่ได้มีวัตถุประสงค์เพื่อก่อให้เกิดกิจกรรมทางการเงิน, การลงทุน, การซื้อขาย, ข้อเสนอแนะ หรือคำแนะนำประเภทอื่น ๆ ที่ให้หรือรับรองโดย TradingView อ่านเพิ่มเติมใน ข้อกำหนดการใช้งาน
สคริปต์โอเพนซอร์ซ
ด้วยเจตนารมณ์หลักของ TradingView ผู้สร้างสคริปต์นี้ได้ทำให้เป็นโอเพนซอร์ส เพื่อให้เทรดเดอร์สามารถตรวจสอบและยืนยันฟังก์ชันการทำงานของมันได้ ขอชื่นชมผู้เขียน! แม้ว่าคุณจะใช้งานได้ฟรี แต่โปรดจำไว้ว่าการเผยแพร่โค้ดซ้ำจะต้องเป็นไปตาม กฎระเบียบการใช้งาน ของเรา
คำจำกัดสิทธิ์ความรับผิดชอบ
ข้อมูลและบทความไม่ได้มีวัตถุประสงค์เพื่อก่อให้เกิดกิจกรรมทางการเงิน, การลงทุน, การซื้อขาย, ข้อเสนอแนะ หรือคำแนะนำประเภทอื่น ๆ ที่ให้หรือรับรองโดย TradingView อ่านเพิ่มเติมใน ข้อกำหนดการใช้งาน