NBSG_Market Dashboard
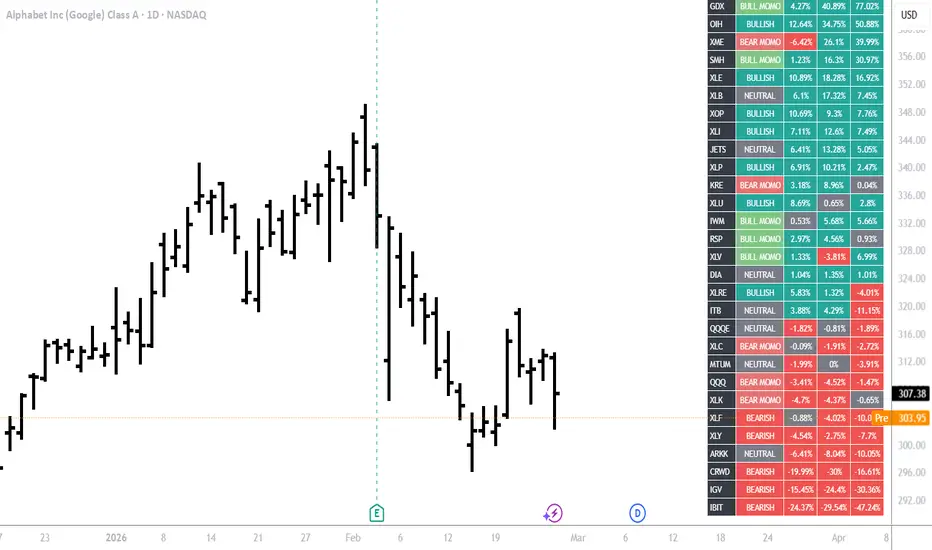
Market Structure & Relative Strength Dashboard
Overview
The Market Structure & Relative Strength Dashboard is a comprehensive multi-timeframe analysis tool designed to identify leading sectors and stocks. By comparing a custom list of tickers against a benchmark (e.g., S&P 500), this dashboard ranks assets based on their true outperformance rather than just absolute price action.
How It Works
The dashboard evaluates assets using two primary metrics:
1. Relative Strength (RS) Scoring
The script calculates the performance of each ticker minus the performance of the benchmark across three lookback periods:
1 Month (21 trading days)
3 Months (63 trading days)
6 Months (126 trading days)
The table is then automatically sorted by the average score of these three periods, placing the strongest leaders at the top.
2. Trend Structure Analysis
Beyond simple performance, the dashboard uses a proprietary trend-tracking logic based on Volume Weighted Moving Averages (VWMA). It classifies each asset into one of five states:
BULLISH: Strong trend with momentum and price trading above the structural envelope.
BULL MOMO: Momentum is positive (8/13/21 VWMA alignment).
NEUTRAL: No clear trend or mean reversion.
BEAR MOMO: Momentum is negative.
BEARISH: Significant structural breakdown.
Features
Fully Customizable: Input up to 30 tickers of your choice (Sectors, Crypto, Forex, or Stocks).
Benchmark Selection: Compare your list against the SPX, NASDAQ, Bitcoin, or any other index.
Dynamic Sorting: The dashboard re-ranks the list in real-time based on relative performance.
Visual Clarity: Heatmap-style coloring allows you to spot rotation and momentum shifts at a glance.
How To Use
Identify Leaders: Look for tickers at the top of the list that are highlighted in "Bullish" or "Bull Momo" states.
Spot Divergence: If a ticker has high 6-month RS but low 1-month RS, it may be undergoing a healthy pullback or losing its leadership.
Rotation Trading: Use the dashboard to see which sectors are beginning to show green RS values (outperforming the SPX) before the price breakout occurs on the main chart.
Technical Settings
Benchmark: The symbol used for comparison (Default: CBOE:SPX).
Structure Calculation: Based on 8, 13, and 21 VWMAs for momentum, and 34-period High/Low VWMAs for trend support/resistance.
Overview
The Market Structure & Relative Strength Dashboard is a comprehensive multi-timeframe analysis tool designed to identify leading sectors and stocks. By comparing a custom list of tickers against a benchmark (e.g., S&P 500), this dashboard ranks assets based on their true outperformance rather than just absolute price action.
How It Works
The dashboard evaluates assets using two primary metrics:
1. Relative Strength (RS) Scoring
The script calculates the performance of each ticker minus the performance of the benchmark across three lookback periods:
1 Month (21 trading days)
3 Months (63 trading days)
6 Months (126 trading days)
The table is then automatically sorted by the average score of these three periods, placing the strongest leaders at the top.
2. Trend Structure Analysis
Beyond simple performance, the dashboard uses a proprietary trend-tracking logic based on Volume Weighted Moving Averages (VWMA). It classifies each asset into one of five states:
BULLISH: Strong trend with momentum and price trading above the structural envelope.
BULL MOMO: Momentum is positive (8/13/21 VWMA alignment).
NEUTRAL: No clear trend or mean reversion.
BEAR MOMO: Momentum is negative.
BEARISH: Significant structural breakdown.
Features
Fully Customizable: Input up to 30 tickers of your choice (Sectors, Crypto, Forex, or Stocks).
Benchmark Selection: Compare your list against the SPX, NASDAQ, Bitcoin, or any other index.
Dynamic Sorting: The dashboard re-ranks the list in real-time based on relative performance.
Visual Clarity: Heatmap-style coloring allows you to spot rotation and momentum shifts at a glance.
How To Use
Identify Leaders: Look for tickers at the top of the list that are highlighted in "Bullish" or "Bull Momo" states.
Spot Divergence: If a ticker has high 6-month RS but low 1-month RS, it may be undergoing a healthy pullback or losing its leadership.
Rotation Trading: Use the dashboard to see which sectors are beginning to show green RS values (outperforming the SPX) before the price breakout occurs on the main chart.
Technical Settings
Benchmark: The symbol used for comparison (Default: CBOE:SPX).
Structure Calculation: Based on 8, 13, and 21 VWMAs for momentum, and 34-period High/Low VWMAs for trend support/resistance.

คำจำกัดสิทธิ์ความรับผิดชอบ
ข้อมูลและบทความไม่ได้มีวัตถุประสงค์เพื่อก่อให้เกิดกิจกรรมทางการเงิน, การลงทุน, การซื้อขาย, ข้อเสนอแนะ หรือคำแนะนำประเภทอื่น ๆ ที่ให้หรือรับรองโดย TradingView อ่านเพิ่มเติมใน ข้อกำหนดการใช้งาน
คำจำกัดสิทธิ์ความรับผิดชอบ
ข้อมูลและบทความไม่ได้มีวัตถุประสงค์เพื่อก่อให้เกิดกิจกรรมทางการเงิน, การลงทุน, การซื้อขาย, ข้อเสนอแนะ หรือคำแนะนำประเภทอื่น ๆ ที่ให้หรือรับรองโดย TradingView อ่านเพิ่มเติมใน ข้อกำหนดการใช้งาน