OPEN-SOURCE SCRIPT
Adaptive RSI Supertrend [MarkitTick]
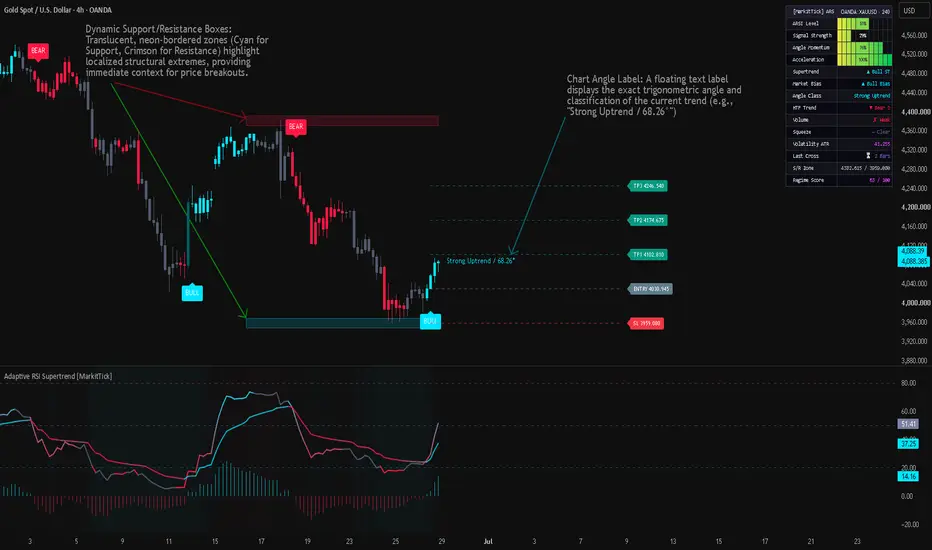
💡 A highly advanced, multi-dimensional momentum and volatility tracking ecosystem designed for professional market analysis. Rather than relying on traditional price-based trailing stops, this indicator projects a volatility-banded Supertrend directly onto an Adaptive Relative Strength Index (ARSI). This creates an incredibly responsive momentum oscillator that dynamically adjusts its own thresholds based on underlying market kinematics. By integrating high-order digital signal processing filters, higher timeframe confirmations, and volume-weighted validation, this tool provides a comprehensive, terminal-style perspective on market regime, momentum acceleration, and localized price extremes without succumbing to the noise typical of standard oscillators.
✨ Originality and Utility
The standard Relative Strength Index is frequently plagued by false signals, erratic whipsaws during consolidation, and a failure to contextualize momentum within broader structural trends. This script resolves these systemic inefficiencies through a deliberate and mathematically sound synthesis of disparate analytical domains. The combination of an ARSI with a localized Supertrend is not an arbitrary pairing; it solves the problem of static overbought/oversold boundaries. By mapping average true range (ATR) bands onto the RSI itself, the indicator creates dynamic, breathing support and resistance levels for momentum. Furthermore, the integration of advanced smoothing algorithms (Kalman and LLAMA) strips out high-frequency noise, ensuring that crossovers between the ARSI and the Supertrend-derived Merged Line represent statistically significant momentum shifts rather than fleeting market anomalies. This unified framework replaces the need for an overlapping array of disparate indicators, offering a singular, high-contrast dashboard for absolute market clarity.
🔬 Methodology and Concepts
The internal architecture of this tool is built upon several synchronized analytical layers, heavily optimized to protect the integrity of the underlying logic while delivering seamless visual output.
● Adaptive Momentum Core
At the heart of the script is the ARSI, which abandons traditional static lookbacks in favor of a responsive differential tracking model. It evaluates the absolute range of price action against directional movement, feeding these differences through a recursive smoothing engine. This results in an oscillator that remains highly sensitive to genuine trend initiation while heavily penalizing sideways chop.
● Digital Signal Processing (DSP) Filters
The raw momentum data is processed through user-selectable DSP algorithms to extract the true signal from market noise. The Kalman Filter dynamically estimates the true state of momentum by balancing process noise against measurement noise, adapting instantly to volatility spikes. Alternatively, the LLAMA filter applies an efficiency-ratio-driven alpha scaling model, tightening its smoothing factor during periods of low efficiency and relaxing it during strong directional bursts.
● Oscillator-Bound Supertrend
Instead of applying a Supertrend to price, the script calculates a specialized ATR based on the frame-to-frame variance of the ARSI. It then projects upper and lower deviation bands around the ARSI, maintaining a directional bias based on trailing breakouts. The resulting baseline is then averaged with the DSP-filtered signal to create the "Merged Line," serving as the ultimate zero-lag trailing threshold for momentum.
● Multi-Factor Regime Scoring
The script continuously evaluates the broader market context by scoring four distinct components: the absolute level of the ARSI, the trigonometric angle of the ARSI trajectory, the state of the oscillator Supertrend, and the relationship of price to a macroeconomic baseline moving average. These factors are normalized and aggregated into a 0-100 Regime Score, offering a unified metric of trend health.
🎨 Visual Guide
The visual presentation is engineered for high-contrast, dark-mode optimized aesthetics, providing immediate, terminal-style data processing without chart clutter.
● Chart Elements
● Oscillator Pane Elements
● The Analytics Dashboard
A fixed, dark-background HUD presents granular telemetry using segmented block bars and color-coded text for rapid scannability:
📖 How to Use
⚙️ Inputs and Settings
🔍 Deconstruction of the Underlying Scientific and Academic Framework
This indicator relies on a robust foundation of applied mathematics and digital signal processing. The core methodology employs non-linear dynamic state estimation. Unlike standard moving averages that suffer from inherent group delay, the integration of algorithms akin to the Kalman filter allows the script to recursively project the next state of momentum and update that projection based on incoming price data. This minimizes lag while aggressively smoothing standard deviation anomalies.
Furthermore, the application of volatility banding (ATR) directly to an bounded oscillator (RSI) represents a shift from price-domain analysis to momentum-domain analysis. By calculating the variance of the momentum itself, the script acknowledges that momentum has its own distinct volatility profile, independent of price action. The kinematics of the trend are evaluated using trigonometric functions to derive the slope (velocity) and the rate of change of the slope (acceleration). This multidimensional approach ensures that signals are not generated merely by price crossing a threshold, but by a mathematically validated shift in the kinetic energy of the market.
⚠️ Disclaimer
All provided scripts and indicators are strictly for educational exploration and must not be interpreted as financial advice or a recommendation to execute trades. We expressly disclaim all liability for any financial losses or damages that may result, directly or indirectly, from the reliance on or application of these tools. Market participation carries inherent risk where past performance never guarantees future returns, leaving all investment decisions and due diligence solely at your own discretion.
✨ Originality and Utility
The standard Relative Strength Index is frequently plagued by false signals, erratic whipsaws during consolidation, and a failure to contextualize momentum within broader structural trends. This script resolves these systemic inefficiencies through a deliberate and mathematically sound synthesis of disparate analytical domains. The combination of an ARSI with a localized Supertrend is not an arbitrary pairing; it solves the problem of static overbought/oversold boundaries. By mapping average true range (ATR) bands onto the RSI itself, the indicator creates dynamic, breathing support and resistance levels for momentum. Furthermore, the integration of advanced smoothing algorithms (Kalman and LLAMA) strips out high-frequency noise, ensuring that crossovers between the ARSI and the Supertrend-derived Merged Line represent statistically significant momentum shifts rather than fleeting market anomalies. This unified framework replaces the need for an overlapping array of disparate indicators, offering a singular, high-contrast dashboard for absolute market clarity.
🔬 Methodology and Concepts
The internal architecture of this tool is built upon several synchronized analytical layers, heavily optimized to protect the integrity of the underlying logic while delivering seamless visual output.
● Adaptive Momentum Core
At the heart of the script is the ARSI, which abandons traditional static lookbacks in favor of a responsive differential tracking model. It evaluates the absolute range of price action against directional movement, feeding these differences through a recursive smoothing engine. This results in an oscillator that remains highly sensitive to genuine trend initiation while heavily penalizing sideways chop.
● Digital Signal Processing (DSP) Filters
The raw momentum data is processed through user-selectable DSP algorithms to extract the true signal from market noise. The Kalman Filter dynamically estimates the true state of momentum by balancing process noise against measurement noise, adapting instantly to volatility spikes. Alternatively, the LLAMA filter applies an efficiency-ratio-driven alpha scaling model, tightening its smoothing factor during periods of low efficiency and relaxing it during strong directional bursts.
● Oscillator-Bound Supertrend
Instead of applying a Supertrend to price, the script calculates a specialized ATR based on the frame-to-frame variance of the ARSI. It then projects upper and lower deviation bands around the ARSI, maintaining a directional bias based on trailing breakouts. The resulting baseline is then averaged with the DSP-filtered signal to create the "Merged Line," serving as the ultimate zero-lag trailing threshold for momentum.
● Multi-Factor Regime Scoring
The script continuously evaluates the broader market context by scoring four distinct components: the absolute level of the ARSI, the trigonometric angle of the ARSI trajectory, the state of the oscillator Supertrend, and the relationship of price to a macroeconomic baseline moving average. These factors are normalized and aggregated into a 0-100 Regime Score, offering a unified metric of trend health.
🎨 Visual Guide
The visual presentation is engineered for high-contrast, dark-mode optimized aesthetics, providing immediate, terminal-style data processing without chart clutter.
● Chart Elements
- Color-Matched Candles: Price candles are painted based on the kinetic relationship between the ARSI and its signal line. Neon Cyan indicates strong bullish momentum, Dark Teal indicates weak bullish momentum, Deep Crimson indicates strong bearish momentum, and Maroon denotes weak bearish pressure. Slate Gray represents a neutral momentum state.
- Dynamic Support/Resistance Boxes: Translucent, neon-bordered zones (Cyan for Support, Crimson for Resistance) highlight localized structural extremes, providing immediate context for price breakouts.
- Trade Projection Labels: When crossover signals fire, dashed projection lines emerge, extending forward to display precisely calculated Entry (Slate), Stop Loss (Crimson), and multi-tiered Take Profit (Neon Green) levels based on dynamic risk-to-reward parameters.
- Chart Angle Label: A floating text label displays the exact trigonometric angle and classification of the current trend (e.g., "Strong Uptrend / 45.2°").
● Oscillator Pane Elements
- Adaptive RSI Line: Plotted with a dynamic gradient that transitions from Deep Crimson (extreme weakness) to Neon Cyan (extreme strength), instantly conveying momentum depth.
- Merged Signal Line: A distinct Neon Purple to Deep Pink gradient line acting as the trailing support/resistance for the ARSI.
- Divergence Histogram: Translucent Cyan and Red histogram bars plot the delta between the ARSI and the Merged Line, visualizing the acceleration or deceleration of momentum crosses.
- Background Shading: The oscillator pane background shifts to a deep blue/purple tone during overbought (above 80) and oversold (below 20) extremes. A striking Electric Gold background illuminates periods where momentum enters a highly compressed "Squeeze" state.
- Signal Markers: Crisp "BULL" (Cyan) and "BEAR" (Red) text labels appear on the oscillator when fully validated crossovers occur.
● The Analytics Dashboard
A fixed, dark-background HUD presents granular telemetry using segmented block bars and color-coded text for rapid scannability:
- ARSI Level: Percentage reading of the current momentum state.
- Signal Strength: Block visualization of the DSP-filtered baseline.
- Angle Momentum & Acceleration: Metrics tracking the velocity and delta-velocity of the trend trajectory.
- Supertrend & Market Bias: Text readouts indicating the dominant structural direction.
- HTF Trend & Volume: Validation checks displaying the alignment of higher timeframes and localized volume surges.
- Volatility ATR & Last Cross: Precise numerical readouts of market expansion and the duration since the last major signal.
- Regime Score: The composite 0-100 metric, color-coded from Crimson (Bear) to Neon Magenta (Transition) to Cyan (Bull).
📖 How to Use
- Identify Momentum Regime: Monitor the Dashboard's Regime Score. A score above 70 combined with a Neon Cyan ARSI line indicates an environment where long positions are statistically favored.
- Trade the Crossover: Wait for the ARSI to cross the Merged Line. Validated crosses will generate a distinct "BULL" or "BEAR" label. Check the Dashboard to ensure the Volume Filter and HTF Trend are aligned (marked with a green checkmark).
- Navigate Squeezes: When the oscillator background turns Electric Gold, the market is experiencing a severe volatility contraction. Avoid initiating new positions during the squeeze. Wait for the background color to clear, accompanied by an Alert indicating a Squeeze Breakout, before trading the subsequent expansion.
- Manage Risk via Trade Labels: Upon a valid signal, utilize the automatically projected Entry, SL, and TP lines on the main chart to structure your position sizing according to the script's ATR-derived risk mechanics.
⚙️ Inputs and Settings
- ARSI & Signal Lengths: Controls the primary lookback periods for the oscillator and its baseline.
- Signal Filter Type: Select between RMA, Kalman Filter, or LLAMA to dictate the specific mathematical model used for noise reduction.
- Supertrend ATR Length & Factor: Adjusts the sensitivity and width of the volatility bands applied to the oscillator.
- Volume Filter Multiplier: Determines the threshold required for volume validation (e.g., 1.5 requires volume to be 50% above its moving average).
- HTF Timeframe: Defines the higher timeframe used for macro-trend alignment (defaults to Daily).
- Squeeze Angle Threshold: The maximum absolute angle permitted to trigger a volatility contraction state.
- Trade Labels (Risk:Reward): Allows fine-tuning of the Stop Loss padding and the precise ratios for TP1, TP2, and TP3 targets.
🔍 Deconstruction of the Underlying Scientific and Academic Framework
This indicator relies on a robust foundation of applied mathematics and digital signal processing. The core methodology employs non-linear dynamic state estimation. Unlike standard moving averages that suffer from inherent group delay, the integration of algorithms akin to the Kalman filter allows the script to recursively project the next state of momentum and update that projection based on incoming price data. This minimizes lag while aggressively smoothing standard deviation anomalies.
Furthermore, the application of volatility banding (ATR) directly to an bounded oscillator (RSI) represents a shift from price-domain analysis to momentum-domain analysis. By calculating the variance of the momentum itself, the script acknowledges that momentum has its own distinct volatility profile, independent of price action. The kinematics of the trend are evaluated using trigonometric functions to derive the slope (velocity) and the rate of change of the slope (acceleration). This multidimensional approach ensures that signals are not generated merely by price crossing a threshold, but by a mathematically validated shift in the kinetic energy of the market.
⚠️ Disclaimer
All provided scripts and indicators are strictly for educational exploration and must not be interpreted as financial advice or a recommendation to execute trades. We expressly disclaim all liability for any financial losses or damages that may result, directly or indirectly, from the reliance on or application of these tools. Market participation carries inherent risk where past performance never guarantees future returns, leaving all investment decisions and due diligence solely at your own discretion.
สคริปต์แบบโอเพนซอร์ส
ด้วยเจตนารมณ์หลักของ TradingView ผู้สร้างสคริปต์นี้ได้ทำให้เป็นโอเพนซอร์ส เพื่อให้เทรดเดอร์สามารถตรวจสอบและยืนยันฟังก์ชันการทำงานของมันได้ ขอชื่นชมผู้เขียน! แม้ว่าคุณจะใช้งานได้ฟรี แต่โปรดจำไว้ว่าการเผยแพร่โค้ดซ้ำจะต้องเป็นไปตาม กฎระเบียบการใช้งาน ของเรา

💡 Proprietary indicators. Original research. Built by analysts who trade.
📢 Free Telegram: t.me/MarkitTick_Updates
👑 Premium: TradingView Marketplace
📘 Guides: markittick.com
📢 Free Telegram: t.me/MarkitTick_Updates
👑 Premium: TradingView Marketplace
📘 Guides: markittick.com
คำจำกัดสิทธิ์ความรับผิดชอบ
ข้อมูลและบทความไม่ได้มีวัตถุประสงค์เพื่อก่อให้เกิดกิจกรรมทางการเงิน, การลงทุน, การซื้อขาย, ข้อเสนอแนะ หรือคำแนะนำประเภทอื่น ๆ ที่ให้หรือรับรองโดย TradingView อ่านเพิ่มเติมใน ข้อกำหนดการใช้งาน
สคริปต์แบบโอเพนซอร์ส
ด้วยเจตนารมณ์หลักของ TradingView ผู้สร้างสคริปต์นี้ได้ทำให้เป็นโอเพนซอร์ส เพื่อให้เทรดเดอร์สามารถตรวจสอบและยืนยันฟังก์ชันการทำงานของมันได้ ขอชื่นชมผู้เขียน! แม้ว่าคุณจะใช้งานได้ฟรี แต่โปรดจำไว้ว่าการเผยแพร่โค้ดซ้ำจะต้องเป็นไปตาม กฎระเบียบการใช้งาน ของเรา
💡 Proprietary indicators. Original research. Built by analysts who trade.
📢 Free Telegram: t.me/MarkitTick_Updates
👑 Premium: TradingView Marketplace
📘 Guides: markittick.com
📢 Free Telegram: t.me/MarkitTick_Updates
👑 Premium: TradingView Marketplace
📘 Guides: markittick.com
คำจำกัดสิทธิ์ความรับผิดชอบ
ข้อมูลและบทความไม่ได้มีวัตถุประสงค์เพื่อก่อให้เกิดกิจกรรมทางการเงิน, การลงทุน, การซื้อขาย, ข้อเสนอแนะ หรือคำแนะนำประเภทอื่น ๆ ที่ให้หรือรับรองโดย TradingView อ่านเพิ่มเติมใน ข้อกำหนดการใช้งาน