Pattern Forecast Pro Acht
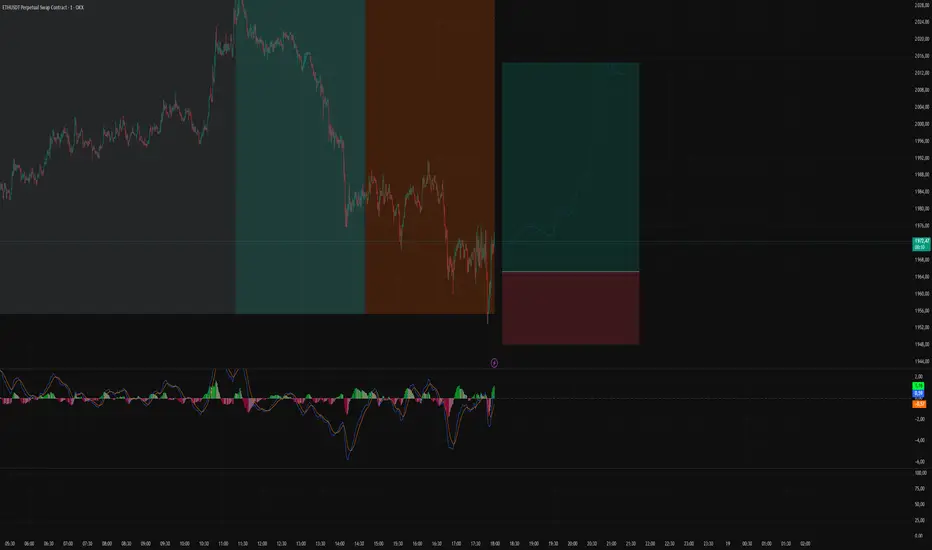
Evaluation Window — the period in which similar segments are searched (the wider it is, the more patterns, but the higher the load).
Forecast Window — the length of the forecast (how many bars ahead the line will be drawn).
Similarity Metric — similarity metric (Correlation, Cosine, Euclidean, Manhattan).
Optimization — search mode: Similarity (maximum similarity) or Dissimilarity (minimum similarity, i.e., opposite pattern).
Top N Patterns — number of best patterns to average (1 = only the best).
Forecast Construction — forecast construction method (Cumulative, Mean, Linreg).
Use Volume Filter — enable volume filtering.
Volume Threshold — volume deviation threshold (e.g., 1.5 means that the volume on the evaluated segment should not exceed the current volume by more than 1.5 times and should not be lower than it by more than 1/1.5).
Normalize by Volatility — enable volatility normalization.
Show Confidence Interval — show confidence interval.
Confidence Level — interval width as a percentage of price (or in units of standard deviation; in this implementation, a fixed percentage).
Show Matched Pattern Line — show the best found pattern line.
Show Areas — show color zones.
Style settings: color and style of the forecast line, zone colors.
Forecast Window — the length of the forecast (how many bars ahead the line will be drawn).
Similarity Metric — similarity metric (Correlation, Cosine, Euclidean, Manhattan).
Optimization — search mode: Similarity (maximum similarity) or Dissimilarity (minimum similarity, i.e., opposite pattern).
Top N Patterns — number of best patterns to average (1 = only the best).
Forecast Construction — forecast construction method (Cumulative, Mean, Linreg).
Use Volume Filter — enable volume filtering.
Volume Threshold — volume deviation threshold (e.g., 1.5 means that the volume on the evaluated segment should not exceed the current volume by more than 1.5 times and should not be lower than it by more than 1/1.5).
Normalize by Volatility — enable volatility normalization.
Show Confidence Interval — show confidence interval.
Confidence Level — interval width as a percentage of price (or in units of standard deviation; in this implementation, a fixed percentage).
Show Matched Pattern Line — show the best found pattern line.
Show Areas — show color zones.
Style settings: color and style of the forecast line, zone colors.

คำจำกัดสิทธิ์ความรับผิดชอบ
ข้อมูลและบทความไม่ได้มีวัตถุประสงค์เพื่อก่อให้เกิดกิจกรรมทางการเงิน, การลงทุน, การซื้อขาย, ข้อเสนอแนะ หรือคำแนะนำประเภทอื่น ๆ ที่ให้หรือรับรองโดย TradingView อ่านเพิ่มเติมใน ข้อกำหนดการใช้งาน
คำจำกัดสิทธิ์ความรับผิดชอบ
ข้อมูลและบทความไม่ได้มีวัตถุประสงค์เพื่อก่อให้เกิดกิจกรรมทางการเงิน, การลงทุน, การซื้อขาย, ข้อเสนอแนะ หรือคำแนะนำประเภทอื่น ๆ ที่ให้หรือรับรองโดย TradingView อ่านเพิ่มเติมใน ข้อกำหนดการใช้งาน