OPEN-SOURCE SCRIPT
Volume Whale Zones [ChartPrime]
🔶 OVERVIEW
Volume Whale Zones [ChartPrime] is a dynamic structural volume engine designed to detect and stabilize the most actively traded price region inside a rolling range.
Instead of plotting a traditional static Volume Profile, this indicator builds a state-based, volatility-adjusted Point of Control (PoC) model that evolves only when true structural expansion occurs.
The result is a highly stable institutional-grade “Hot Zone” — a price area where market participation is most concentrated.
🔶 CORE PHILOSOPHY

Most volume tools react instantly to small fluctuations.
Volume Whale Zones [ChartPrime] does not.
It is built on three core principles:
This prevents noise and highlights meaningful accumulation or distribution zones.
🔶 RANGE ENGINE
The indicator continuously tracks:
The Hot Zone only recalculates aggressively when:
• A new structural high forms
• Or a new structural low forms
If the range does not expand, the zone remains stable.
This avoids over-reactive behavior during sideways movement.
🔶 VOLUME PROFILE CORE
Inside the defined range:
Unlike traditional Volume Profile:
• This profile recalculates continuously
• But structural filtering prevents instability
🔶 THREE-LAYER HOT ZONE STABILIZATION ENGINE
This is the most important part of the model.
The Hot Zone is built in three stages:
Level 0 – Structural Base
Level 1 – Refined Zone
Level 2 – Final Stable Zone

The final output is a multi-stage stabilized participation level.
🔶 VOLATILITY CLAMPING
To prevent distortion during extreme moves:
This produces institutional-style smoothing behavior.
🔶 VISUAL STRUCTURE

The zone only visually reacts when real structural change occurs.
🔶 HOT ZONE DEVIATION OSCILLATOR
The indicator includes a built-in deviation measurement:
This gives traders immediate context:
• Is price stretched above value?
• Is price compressed below value?
• Is price sitting directly at the participation core?


🔶 LOOKBACK ORANGE HOT ZONE (CONTEXT OVERLAY)
The indicator plots two visual “Hot Zone” layers:
1) Main Hot Zone (Stable Structural Line)
2) Lookback Hot Zone (Orange Window Line)

So visually you get:
• Long-term stable zone (main)
• Short-term contextual zone (orange lookback window)
🔶 WHAT THE HOT ZONE REPRESENTS
The Hot Zone acts as:
Price often:
• Reacts around it
• Consolidates near it
• Expands away from it
• Returns to it after extremes
🔶 HOW TO USE
Best suited for:
• Range traders
• Intraday scalpers
• Swing continuation traders
• Liquidity-based strategies
🔶 DIFFERENCE FROM TRADITIONAL POC
Traditional PoC:
• Recalculates every bar
• Flickers frequently
• Is highly reactive
Volume Whale Zones [ChartPrime]:
• State-based
• Volatility-filtered
• Multi-layer stabilized
• Structure-aware
This produces far cleaner institutional behavior.
🔶 CONCLUSION
Volume Whale Zones [ChartPrime] transforms raw volume data into a stabilized structural participation model.
By combining:
• Rolling range detection
• Dynamic volume profiling
• ATR-based clamping
• Multi-stage stabilization
• Deviation analytics
It delivers a powerful value engine that reveals where the market is truly active — and where price is statistically stretched.
This is not just a PoC.
It is a volatility-aware institutional participation zone.
Volume Whale Zones [ChartPrime] is a dynamic structural volume engine designed to detect and stabilize the most actively traded price region inside a rolling range.
Instead of plotting a traditional static Volume Profile, this indicator builds a state-based, volatility-adjusted Point of Control (PoC) model that evolves only when true structural expansion occurs.
The result is a highly stable institutional-grade “Hot Zone” — a price area where market participation is most concentrated.
🔶 CORE PHILOSOPHY
Most volume tools react instantly to small fluctuations.
Volume Whale Zones [ChartPrime] does not.
It is built on three core principles:
- Structural range expansion matters more than small fluctuations.
- Volume concentration must be volatility-adjusted.
- Stability requires state logic, not raw recalculation.
This prevents noise and highlights meaningful accumulation or distribution zones.
🔶 RANGE ENGINE
The indicator continuously tracks:
- Highest high over the lookback window.
- Lowest low over the lookback window.
- Whether the range has structurally expanded.
The Hot Zone only recalculates aggressively when:
• A new structural high forms
• Or a new structural low forms
If the range does not expand, the zone remains stable.
This avoids over-reactive behavior during sideways movement.
🔶 VOLUME PROFILE CORE
Inside the defined range:
- The range is divided into 50 price rows.
- Volume is accumulated per price bin.
- The highest volume bin becomes the raw PoC.
Unlike traditional Volume Profile:
• This profile recalculates continuously
• But structural filtering prevents instability
🔶 THREE-LAYER HOT ZONE STABILIZATION ENGINE
This is the most important part of the model.
The Hot Zone is built in three stages:
Level 0 – Structural Base
- Raw PoC is detected.
- Movement is volatility-clamped using ATR.
- Sudden jumps are limited to ATR × 2.
- EMA smoothing is applied.
Level 1 – Refined Zone
- Only updates if price displacement exceeds ATR threshold.
- Filters minor structural shifts.
- Acts as a mid-level stabilizer.
Level 2 – Final Stable Zone
- Only updates if Level 1 exceeds another ATR band.
- Creates long-term stability.
- Prevents rapid zone flickering.
The final output is a multi-stage stabilized participation level.
🔶 VOLATILITY CLAMPING
To prevent distortion during extreme moves:
- PoC movement is limited using ATR × 2.
- Outlier jumps are capped.
- Sudden spikes cannot instantly shift the Hot Zone.
This produces institutional-style smoothing behavior.
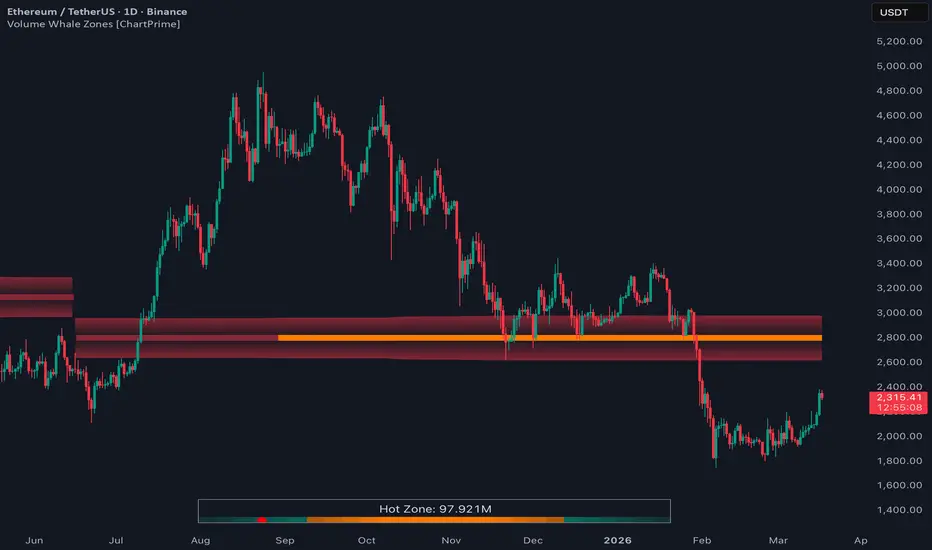
🔶 VISUAL STRUCTURE
- Thick central line → Final Hot Zone.
- Optional wide shaded zone above and below.
- Stepline structure highlights state shifts.
- Color transparency increases when structure changes.
The zone only visually reacts when real structural change occurs.
🔶 HOT ZONE DEVIATION OSCILLATOR
The indicator includes a built-in deviation measurement:
- Deviation = (Close − Hot Zone) / ATR.
- Values are clamped between -4 and +4.
- Displayed as a centered horizontal oscillator table.
- Active cell marks current price displacement.
This gives traders immediate context:
• Is price stretched above value?
• Is price compressed below value?
• Is price sitting directly at the participation core?
🔶 LOOKBACK ORANGE HOT ZONE (CONTEXT OVERLAY)
The indicator plots two visual “Hot Zone” layers:
1) Main Hot Zone (Stable Structural Line)
- The thick red Hot Zone line is the fully stabilized output (Level 2).
- It persists across history and only shifts when structural + ATR conditions are met.
2) Lookback Hot Zone (Orange Window Line)
- The orange line is the same Hot Zone level, but displayed only for the last Lookback bars.
- This gives traders a clean “recent context” view without long historical clutter.
- It helps compare where the zone currently sits versus older structural states.
So visually you get:
• Long-term stable zone (main)
• Short-term contextual zone (orange lookback window)
🔶 WHAT THE HOT ZONE REPRESENTS
The Hot Zone acts as:
- Institutional equilibrium area.
- Participation gravity center.
- Accumulation/distribution magnet.
- Reversion anchor during mean cycles.
Price often:
• Reacts around it
• Consolidates near it
• Expands away from it
• Returns to it after extremes
🔶 HOW TO USE
- Use the Hot Zone as a value anchor.
- Trade mean reversion when deviation is extreme.
- Look for breakouts when price compresses tightly around the zone.
- Combine with structure tools or liquidity sweeps.
- Use deviation to filter overextended moves.
Best suited for:
• Range traders
• Intraday scalpers
• Swing continuation traders
• Liquidity-based strategies
🔶 DIFFERENCE FROM TRADITIONAL POC
Traditional PoC:
• Recalculates every bar
• Flickers frequently
• Is highly reactive
Volume Whale Zones [ChartPrime]:
• State-based
• Volatility-filtered
• Multi-layer stabilized
• Structure-aware
This produces far cleaner institutional behavior.
🔶 CONCLUSION
Volume Whale Zones [ChartPrime] transforms raw volume data into a stabilized structural participation model.
By combining:
• Rolling range detection
• Dynamic volume profiling
• ATR-based clamping
• Multi-stage stabilization
• Deviation analytics
It delivers a powerful value engine that reveals where the market is truly active — and where price is statistically stretched.
This is not just a PoC.
It is a volatility-aware institutional participation zone.
สคริปต์โอเพนซอร์ซ
ด้วยเจตนารมณ์หลักของ TradingView ผู้สร้างสคริปต์นี้ได้ทำให้เป็นโอเพนซอร์ส เพื่อให้เทรดเดอร์สามารถตรวจสอบและยืนยันฟังก์ชันการทำงานของมันได้ ขอชื่นชมผู้เขียน! แม้ว่าคุณจะใช้งานได้ฟรี แต่โปรดจำไว้ว่าการเผยแพร่โค้ดซ้ำจะต้องเป็นไปตาม กฎระเบียบการใช้งาน ของเรา

คำจำกัดสิทธิ์ความรับผิดชอบ
ข้อมูลและบทความไม่ได้มีวัตถุประสงค์เพื่อก่อให้เกิดกิจกรรมทางการเงิน, การลงทุน, การซื้อขาย, ข้อเสนอแนะ หรือคำแนะนำประเภทอื่น ๆ ที่ให้หรือรับรองโดย TradingView อ่านเพิ่มเติมใน ข้อกำหนดการใช้งาน
สคริปต์โอเพนซอร์ซ
ด้วยเจตนารมณ์หลักของ TradingView ผู้สร้างสคริปต์นี้ได้ทำให้เป็นโอเพนซอร์ส เพื่อให้เทรดเดอร์สามารถตรวจสอบและยืนยันฟังก์ชันการทำงานของมันได้ ขอชื่นชมผู้เขียน! แม้ว่าคุณจะใช้งานได้ฟรี แต่โปรดจำไว้ว่าการเผยแพร่โค้ดซ้ำจะต้องเป็นไปตาม กฎระเบียบการใช้งาน ของเรา
คำจำกัดสิทธิ์ความรับผิดชอบ
ข้อมูลและบทความไม่ได้มีวัตถุประสงค์เพื่อก่อให้เกิดกิจกรรมทางการเงิน, การลงทุน, การซื้อขาย, ข้อเสนอแนะ หรือคำแนะนำประเภทอื่น ๆ ที่ให้หรือรับรองโดย TradingView อ่านเพิ่มเติมใน ข้อกำหนดการใช้งาน