OPEN-SOURCE SCRIPT
Casual State Confirmation [DAFE]
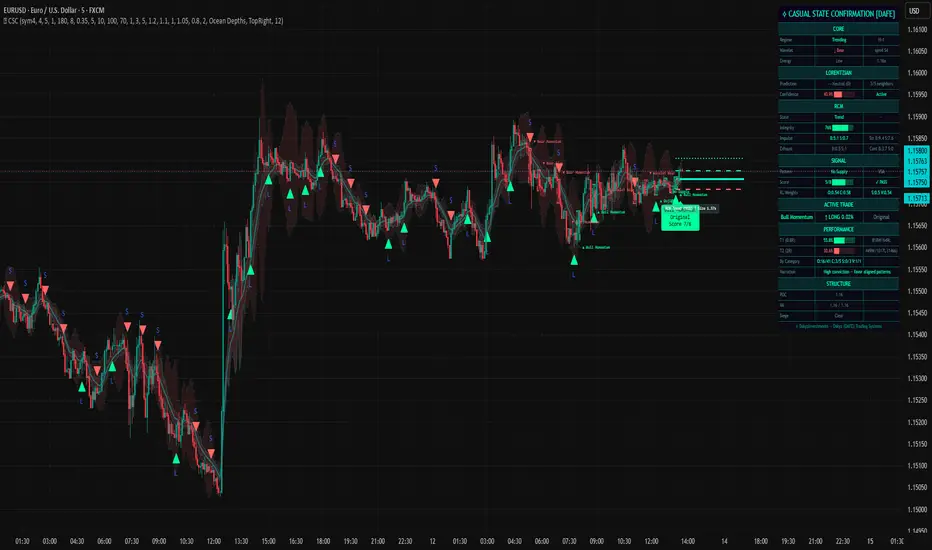
Casual State Confirmation [DAFE]
This is a market-state classification and signal-generation system. Designed for professional proprietary firms and systematic retail traders, this overlay indicator operates on a profound technical thesis: "Confirm the state casually, trade with anticipation.
Most modern trading systems fail because they rely on lag-heavy digital filters, suffer from the "curse of dimensionality" when processing historical charts, or ignore institutional order flow context. ⟡ CSC solves these structural challenges by fusing five cutting-edge quantitative methodologies into a single, cohesive, self-learning visual script:
DEEP MATHEMATICAL ARCHITECTURE
A. Shift-Invariant Stationary Wavelet Transform (SWT)
Traditional digital moving averages (EMA, SMA, HMA) introduce significant phase lag. ⟡ CSC bypasses this limitation using a discrete Stationary Wavelet Transform (SWT), which decomposes price into a series of time-localized frequency sub-bands:
Pine Script®
Where a_J represents the low-frequency approximation of the trend, and d_j represents the high-frequency detail bands at scale j.
Smoothing Splitting: To preserve high-frequency market shocks, an Exponential Moving Average (EMA) is applied only to the approximation bands (a_1–a_4). The detail bands (d_1–d_4) remain completely unsmoothed. This mathematical partition ensures that while trend tracking is smoothed, raw energy and volatility spikes are captured with zero time delay.
Regime Classification via Hurst Exponent (H): The script extracts log-scale variations across multiple wavelet steps to estimate the Hurst Exponent. If H > 0.55, the market state is classified as Trending (persistent). If H < 0.45, it is classified as Mean Reverting (anti-persistent). Otherwise, it is flagged as Random (Gaussian noise).
B. 13-Feature Non-Euclidean Lorentzian k-NN Classification
Standard machine learning models often suffer from high-dimensional distortion. ⟡ CSC projects 13 distinct features (ranging from Hurst exponents and wavelet energy to order flow absorption and RCM integrity) into a non-Euclidean space. Rather than relying on simple Euclidean distances, it uses a Lorentzian Cauchy-like Distance Metric:
Pine Script®
By using a logarithmic distance curve, the Lorentzian metric limits the influence of outlier data, preserving cluster relationships in high-dimensional spaces.
Training Loop Protection (Outcome Delay): To prevent lookahead bias, the k-NN engine implements a delayed-outcome training loop (lorentz_delay). The system waits for a user-defined bar window to pass before evaluating whether a historical pattern resolved as a win (+1.0) or a loss (-1.0). Only once this outcome is locked is the pattern committed to the database.
C. LogicWeights Reinforcement Learning (RL) Engine
Rather than treating all pattern categories equally, ⟡ CSC deploys an adaptive reinforcement learning layer (`LW`). The system categorizes the 21 detectable patterns into four distinct buckets: Original, Candle, Structure, and VSA.
When an execution signal is generated, its category weight is adjusted based on subsequent price action:
Success (T1 Target Hit): The category weight is increased by a learning step of +0.04.
Failure (Stop Loss Hit): The category weight is reduced by -0.04.
This feedback loop ensures that the engine automatically prioritizes pattern types that are currently outperforming under active market conditions.
INPUTS
🌊 Wavelet Engine Parameters
Family (Default: db4): Selects the Mother Wavelet filter coefficients used to compute the SWT.
Haar: Step-like square wavelet. Highly responsive to sudden structural shocks, though prone to jagged bands.
db2 / db4: Orthogonal Daubechies wavelets. Balances time-domain precision and frequency-domain smoothing to preserve trend structures.
sym4: Near-symmetric Symlet wavelet designed to limit phase distortion and asymmetry.
coif2: Coiflet wavelet featuring vanishing moments for both scaling and wavelet functions. Highly localized approximation of micro-trends.
Approximation Smoothing (Default: 3): Applies an EMA filter to smooth approximation bands. Increasing this filters out short-term noise; decreasing it makes wavelet alignment signals more responsive to near-term momentum shifts.
Show Wavelet Bands (Default: true): Renders multi-scale volatility bands calculated directly from SWT detail-band energy coefficients on the chart.
Highlight Energy Surges (Default: false): Highlights the chart background when the combined square of the detail coefficients exceeds its historical average.
🌌 Lorentzian Parameters
Enable Lorentzian (Default: true): Toggles the 13-feature non-Euclidean k-NN classification engine.
K Neighbors (Default: 5): Sets the number of historical nearest neighbors (K) used to construct the prediction vector. Lower values (3-5) respond to localized anomalies; higher values (7-9) demand a broader historical consensus.
Gamma (match strictness) (Default: 1.0): The scale parameter (\gamma) for the Cauchy-like distance kernel. Larger values accept broader historical matches; smaller values enforce strict similarity requirements.
Pattern Memory (Default: 180): Defines the maximum size of the historical feature database.
Outcome Delay (bars) (Default: 8): Enforces a strict temporal window before evaluating trade outcomes to prevent lookahead bias.
Min Confidence for Signal Boost (Default: 0.35): The minimum neighbor similarity percentage required to validate a k-NN signal boost.
🎯 Patterns & Signal Quality Parameters
Original 8 Patterns (Default: true): Toggles the original 8 core patterns (Momentum, Flags, Reversals, Double Tops/Bottoms, Breakouts, Wavelet alignment, and Energy surges).
Candle Patterns (6) (Default: true): Toggles candlestick patterns (Hammer/Shooting Star Absorptions, Exhaustion Wicks, Pin Bars, Engulfing bars, Marubozus, and Dojis).
Structure Patterns (4) (Default: true): Toggles structural patterns (BOS, CHoCH, Liquidity Sweeps, and Order Block Reclaims).
VSA Patterns (3) (Default: true): Toggles Volume Spread Analysis patterns (No Demand, No Supply, Buying/Selling Climaxes, and Stopping Volume).
Minimum Signal Score (of 8) (Default: 6): Sets the minimum confirmation score required to validate an entry signal. The score is calculated across an 8-point validation matrix.
Signal Cooldown (bars) (Default: 12): Establishes a minimum bar interval between consecutive signals to prevent rapid, overlapping trades.
Require Structural Proximity (Default: true): When enabled, signals are blocked unless the entry price is trading near a key MSL level (POC, VAH, VAL, Siege Corridors, or major swing points).
Require RCM Integrity ≥ 50% (Default: true): Blocks signals if the RCM Engines structural integrity falls below 50%, filtering out signals during choppy, low-confidence trend transitions.
🏗 Footprint Parameters
Use Native Footprint (Premium) (Default: true): Requests real-time, tick-level footprint data to calculate exact buying and selling volume distributions at each price level. If unavailable, the system automatically falls back to sub-timeframe volume distributions.
Ticks per Row (Default: 100): Set this to match the tick structure of your instrument.
Value Area % (Default: 70): Sets the statistical boundary of the Value Area.
Fallback TF1 / Fallback TF2 (Default: 1 / 3): The primary and secondary sub-timeframes used to estimate sub-candle volume distributions when native footprint data is unavailable.
🧭 MSL Structure Parameters
Enable MSL (Default: `true`): Toggles the Market Structure Levels engine.
Pivot Length (Default: 5): The lookback period used to identify swing highs and lows for structural calculations.
Plot POC/VAH/VAL (Default: `true`): Renders the POC, VAH, and VAL lines directly on the chart.
🛡 RCM Parameters
Enable RCM (Default: `true`): Toggles the Rotational Market State Engine.
Wavelet → Impulse Injection (Default: 1.2): Adjusts the sensitivity of wavelet energy surges injected into the RCM engine.
Delta → Structure Injection (Default: 1.1): Adjusts the sensitivity of footprint delta imbalances injected into the RCM engine.
Siege → Compression Injection (Default: 1.0): Adjusts the sensitivity of MSL siege proximity metrics injected into the RCM engine.
⚡ Risk Parameters
ATR Stop Multiplier (Default: 0.75): The multiplier applied to ATR to determine the initial stop-loss distance.
R:R Target 1 / R:R Target 2 (Default: 1.0 / 2.0): The target prices for take-profit orders, calculated as a multiple of the initial risk distance.
Show Trade Lines (Default: `true`): Renders entry, stop-loss, and take-profit trade lines on the chart.
DASHBOARD & CHART VISUALS
To help you monitor complex market environments, the system features a real-time Head-Up Display (HUD) and dynamic chart indicators:
A. On-Chart Visuals
Neon Trade Lines: Renders entry (Purple), stop-loss (Crimson), and take-profit targets (Neon Green) trade lines.

Pattern Boxes & Labels: Displays dashed boxes around pattern-triggering candles, accompanied by text badges showing the pattern name, category, and score.

Signal Arrows: Displays L (Long) or S (Short) shapes indicating validated entry zones.

B. Real-Time HUD Table Columns Explained
CORE Section:
Regime: Displays the active market state (Trending, Mean Reverting, or Random), along with the exact Hurst exponent value (H).
Wavelet: Shows wavelet alignment (Bullish, Bearish, or Flat) and active scale.
Energy: Highlights active wavelet energy surges.
LORENTZIAN Section:
Prediction: Shows the k-NN models directional bias (Bullish, Bearish, or Neutral) and its numerical score.
Confidence: Displays a loading-bar visual of neighbor similarity.
RCM Section:
State: Displays active trend states (Bullish, Bearish, or Neutral) and highlights structural damage.
Integrity: Displays a trend strength bar indicator.
Impulse / Exhaust: Compares buy/sell volume conviction and exhaustion levels.
SIGNAL Section:
Pattern / Category / Score: Shows active pattern details and its validation status.
RL Weights: Displays active category weights (O: Original, C: Candle, S: Structure, V: VSA) updated by the reinforcement learning engine.
ACTIVE TRADE Section:
Displays details of the active trade, including name, category, direction, and live unrealized profit/loss.
PERFORMANCE Section:
T1 / T2 Win Rate: Tracks performance at both Target 1 and Target 2, alongside a detailed breakdown of wins and losses by pattern category.
NARRATION Section:
Provides live commentary on structural conditions, warning you of trend transitions or consolidation phases.
STRUCTURE Section:
Displays current POC, VAH, and VAL values, indicating whether price is trading inside the Value Area or near structural siege zones.

OPTIMIZATION FOR VARIOUS TIMEFRAMES & SECTORS
A. 5-Minute Timeframe (Scalping & Order Flow Focus)
Designed to capture rapid, intraday price action and short-term liquidity pools:
Wavelet settings: Family = Haar (highest response rate to sudden price breaks), Approximation Smoothing = 2.
Lorentzian settings: K Neighbors = 3 (highly sensitive to localized historical patterns), Gamma = 0.8 (demands strict similarity matching), Outcome Delay = 5 (speeds up learning feedback).
Signal settings: Minimum Signal Score = 5 (increases trade frequency), Require Structural Proximity = true (ensures trades occur at high-probability location zones).
Asset pairings: Highly effective for high-volume stock index futures (NQ, ES), blue-chip equities (TSLA, NVDA), and liquid currency pairs (EUR/USD, GBP/USD).
B. 10-Minute Timeframe (Intraday Day Trading)
Optimized to capture midday trends while filtering out noise and false breakouts:
Wavelet settings: Family = db2 or db4, Approximation Smoothing = 4.
Lorentzian settings: K Neighbors = 5, Gamma = 1.1, Outcome Delay = 8.
Signal settings: Minimum Signal Score = 6, Require RCM Integrity ≥ 50% = true (filters out choppy consolidation ranges).
Asset pairings: Recommended for major commodity futures (Gold, Crude Oil) and high-market-cap cryptocurrency assets (BTC/USD, ETH/USD).
C. 1-Hour Timeframe (Swing Trading & Structural Position Trading)
Designed for capturing major macroeconomic trends and holding swing positions over days or weeks:
Wavelet settings: Family = sym4 or coif2 (reduces phase distortion), Approximation Smoothing = 6.
Lorentzian settings: K Neighbors = 7 or 9 (demands broad historical consensus), Gamma = 1.5, Outcome Delay = 12 or 15.
Signal settings: Minimum Signal Score = 7 (demands high confluence), Require Structural Proximity = true (requires price to be near major daily or weekly key levels).
Asset pairings: Ideal for spot forex pairs, commodity CFDs, global treasury bonds, and mid-cap equity portfolios.
* These are generalized suggestions. The main suggestion would be to play with the inputs until you find something you are comfortable with.
WEBHOOK & LIVE EXECUTION INTEGRATION BLUEPRINT
Because ⟡ CSC is an overlay indicator rather than a strategy, it utilizes specialized Pine Script `alertcondition` triggers. To bridge these signals to external brokers, prop accounts, or trade routers (such as PineConnector, 3Commas, or Capitalise.ai), you must use TradingViews dynamic placeholder tokens to pass real-time order data through your webhooks.
A. Available Indicator Alert Triggers
The script features four automated alert conditions that you can select in the TradingView alert creation menu:
B. Dynamic JSON Webhook Templates
By using TradingView’s Placeholder Tokens in the Alert Message box, you can pass dynamic execution data to your routing gateway:
Template 1: PineConnector (MetaTrader 4 / MetaTrader 5 Bridge)
To route trades to MT4/MT5, configure your alert message exactly as follows:
Pine Script®
(Note: Replace (sl) and (tp) values with your preferred risk parameters or your brokers specific layout).
Template 2: 3Commas Multi-Bot Trigger
To execute signals on spot or futures crypto exchange accounts, enter the following JSON format in your Alert Message box:
Pine Script®
Template 3: Universal Webhook JSON (For custom programmatic servers)
If you route signals to a custom API or private trading bot server, use this format to pass comprehensive market-state data:
Pine Script®
C. Setting Up Your Webhook in TradingView
PLATFORM COMPLIANCE & RISK DISCLAIMERS
No Guarantee of Financial Returns: This software tool is designed for educational and informational purposes only. It is not financial or investment advice. Systematic trading carries high risks of capital loss.
Hypothetical Backtesting Limitations: All performance statistics displayed in the HUD table are calculated in real time using historical data and are completely simulated. Simulated results have inherent limitations and do not represent live market transactions, brokerage fees, or execution slippage.
User Operational Responsibility: The user is solely responsible for determining position sizing, risk limits, and broker connections. ⟡ CSC is not a financial advisor. Always test Webhook JSON integrations in simulated paper-trading environments before risking live capital.
— Dskyz, Trade with insight. Trade with anticipation. (Don't follow the trend, be the trend)
This is a market-state classification and signal-generation system. Designed for professional proprietary firms and systematic retail traders, this overlay indicator operates on a profound technical thesis: "Confirm the state casually, trade with anticipation.
Most modern trading systems fail because they rely on lag-heavy digital filters, suffer from the "curse of dimensionality" when processing historical charts, or ignore institutional order flow context. ⟡ CSC solves these structural challenges by fusing five cutting-edge quantitative methodologies into a single, cohesive, self-learning visual script:
- A Shift-Invariant Stationary Wavelet Transform (SWT) Engine running 5 selectable Mother Wavelet families with unsmoothed detail bands to capture immediate high-frequency energy shocks.
- A 13-Feature Non-Euclidean Lorentzian k-Nearest Neighbors (k-NN) Classifier with a strict, delayed-outcome training loop that dynamically updates a localized memory database.
- A LogicWeights Reinforcement Learning (RL) Processor that constantly optimizes pattern weight parameters based on realized win/loss trade outcomes.
- A Native Microstructure Footprint & Market Structure Levels (MSL) Engine to verify institutional liquidity zones, Value Areas (VA), and POC locations.
- An Advanced Rotational Market State (RCM) Conviction Engine that continuously calculates structural trend integrity and damage.
DEEP MATHEMATICAL ARCHITECTURE
A. Shift-Invariant Stationary Wavelet Transform (SWT)
Traditional digital moving averages (EMA, SMA, HMA) introduce significant phase lag. ⟡ CSC bypasses this limitation using a discrete Stationary Wavelet Transform (SWT), which decomposes price into a series of time-localized frequency sub-bands:
Where a_J represents the low-frequency approximation of the trend, and d_j represents the high-frequency detail bands at scale j.
Smoothing Splitting: To preserve high-frequency market shocks, an Exponential Moving Average (EMA) is applied only to the approximation bands (a_1–a_4). The detail bands (d_1–d_4) remain completely unsmoothed. This mathematical partition ensures that while trend tracking is smoothed, raw energy and volatility spikes are captured with zero time delay.
Regime Classification via Hurst Exponent (H): The script extracts log-scale variations across multiple wavelet steps to estimate the Hurst Exponent. If H > 0.55, the market state is classified as Trending (persistent). If H < 0.45, it is classified as Mean Reverting (anti-persistent). Otherwise, it is flagged as Random (Gaussian noise).
B. 13-Feature Non-Euclidean Lorentzian k-NN Classification
Standard machine learning models often suffer from high-dimensional distortion. ⟡ CSC projects 13 distinct features (ranging from Hurst exponents and wavelet energy to order flow absorption and RCM integrity) into a non-Euclidean space. Rather than relying on simple Euclidean distances, it uses a Lorentzian Cauchy-like Distance Metric:
By using a logarithmic distance curve, the Lorentzian metric limits the influence of outlier data, preserving cluster relationships in high-dimensional spaces.
Training Loop Protection (Outcome Delay): To prevent lookahead bias, the k-NN engine implements a delayed-outcome training loop (lorentz_delay). The system waits for a user-defined bar window to pass before evaluating whether a historical pattern resolved as a win (+1.0) or a loss (-1.0). Only once this outcome is locked is the pattern committed to the database.
C. LogicWeights Reinforcement Learning (RL) Engine
Rather than treating all pattern categories equally, ⟡ CSC deploys an adaptive reinforcement learning layer (`LW`). The system categorizes the 21 detectable patterns into four distinct buckets: Original, Candle, Structure, and VSA.
When an execution signal is generated, its category weight is adjusted based on subsequent price action:
Success (T1 Target Hit): The category weight is increased by a learning step of +0.04.
Failure (Stop Loss Hit): The category weight is reduced by -0.04.
This feedback loop ensures that the engine automatically prioritizes pattern types that are currently outperforming under active market conditions.
INPUTS
🌊 Wavelet Engine Parameters
Family (Default: db4): Selects the Mother Wavelet filter coefficients used to compute the SWT.
Haar: Step-like square wavelet. Highly responsive to sudden structural shocks, though prone to jagged bands.
db2 / db4: Orthogonal Daubechies wavelets. Balances time-domain precision and frequency-domain smoothing to preserve trend structures.
sym4: Near-symmetric Symlet wavelet designed to limit phase distortion and asymmetry.
coif2: Coiflet wavelet featuring vanishing moments for both scaling and wavelet functions. Highly localized approximation of micro-trends.
Approximation Smoothing (Default: 3): Applies an EMA filter to smooth approximation bands. Increasing this filters out short-term noise; decreasing it makes wavelet alignment signals more responsive to near-term momentum shifts.
Show Wavelet Bands (Default: true): Renders multi-scale volatility bands calculated directly from SWT detail-band energy coefficients on the chart.
Highlight Energy Surges (Default: false): Highlights the chart background when the combined square of the detail coefficients exceeds its historical average.
🌌 Lorentzian Parameters
Enable Lorentzian (Default: true): Toggles the 13-feature non-Euclidean k-NN classification engine.
K Neighbors (Default: 5): Sets the number of historical nearest neighbors (K) used to construct the prediction vector. Lower values (3-5) respond to localized anomalies; higher values (7-9) demand a broader historical consensus.
Gamma (match strictness) (Default: 1.0): The scale parameter (\gamma) for the Cauchy-like distance kernel. Larger values accept broader historical matches; smaller values enforce strict similarity requirements.
Pattern Memory (Default: 180): Defines the maximum size of the historical feature database.
Outcome Delay (bars) (Default: 8): Enforces a strict temporal window before evaluating trade outcomes to prevent lookahead bias.
Min Confidence for Signal Boost (Default: 0.35): The minimum neighbor similarity percentage required to validate a k-NN signal boost.
🎯 Patterns & Signal Quality Parameters
Original 8 Patterns (Default: true): Toggles the original 8 core patterns (Momentum, Flags, Reversals, Double Tops/Bottoms, Breakouts, Wavelet alignment, and Energy surges).
Candle Patterns (6) (Default: true): Toggles candlestick patterns (Hammer/Shooting Star Absorptions, Exhaustion Wicks, Pin Bars, Engulfing bars, Marubozus, and Dojis).
Structure Patterns (4) (Default: true): Toggles structural patterns (BOS, CHoCH, Liquidity Sweeps, and Order Block Reclaims).
VSA Patterns (3) (Default: true): Toggles Volume Spread Analysis patterns (No Demand, No Supply, Buying/Selling Climaxes, and Stopping Volume).
Minimum Signal Score (of 8) (Default: 6): Sets the minimum confirmation score required to validate an entry signal. The score is calculated across an 8-point validation matrix.
Signal Cooldown (bars) (Default: 12): Establishes a minimum bar interval between consecutive signals to prevent rapid, overlapping trades.
Require Structural Proximity (Default: true): When enabled, signals are blocked unless the entry price is trading near a key MSL level (POC, VAH, VAL, Siege Corridors, or major swing points).
Require RCM Integrity ≥ 50% (Default: true): Blocks signals if the RCM Engines structural integrity falls below 50%, filtering out signals during choppy, low-confidence trend transitions.
🏗 Footprint Parameters
Use Native Footprint (Premium) (Default: true): Requests real-time, tick-level footprint data to calculate exact buying and selling volume distributions at each price level. If unavailable, the system automatically falls back to sub-timeframe volume distributions.
Ticks per Row (Default: 100): Set this to match the tick structure of your instrument.
Value Area % (Default: 70): Sets the statistical boundary of the Value Area.
Fallback TF1 / Fallback TF2 (Default: 1 / 3): The primary and secondary sub-timeframes used to estimate sub-candle volume distributions when native footprint data is unavailable.
🧭 MSL Structure Parameters
Enable MSL (Default: `true`): Toggles the Market Structure Levels engine.
Pivot Length (Default: 5): The lookback period used to identify swing highs and lows for structural calculations.
Plot POC/VAH/VAL (Default: `true`): Renders the POC, VAH, and VAL lines directly on the chart.
🛡 RCM Parameters
Enable RCM (Default: `true`): Toggles the Rotational Market State Engine.
Wavelet → Impulse Injection (Default: 1.2): Adjusts the sensitivity of wavelet energy surges injected into the RCM engine.
Delta → Structure Injection (Default: 1.1): Adjusts the sensitivity of footprint delta imbalances injected into the RCM engine.
Siege → Compression Injection (Default: 1.0): Adjusts the sensitivity of MSL siege proximity metrics injected into the RCM engine.
⚡ Risk Parameters
ATR Stop Multiplier (Default: 0.75): The multiplier applied to ATR to determine the initial stop-loss distance.
R:R Target 1 / R:R Target 2 (Default: 1.0 / 2.0): The target prices for take-profit orders, calculated as a multiple of the initial risk distance.
Show Trade Lines (Default: `true`): Renders entry, stop-loss, and take-profit trade lines on the chart.
DASHBOARD & CHART VISUALS
To help you monitor complex market environments, the system features a real-time Head-Up Display (HUD) and dynamic chart indicators:
A. On-Chart Visuals
Neon Trade Lines: Renders entry (Purple), stop-loss (Crimson), and take-profit targets (Neon Green) trade lines.
Pattern Boxes & Labels: Displays dashed boxes around pattern-triggering candles, accompanied by text badges showing the pattern name, category, and score.
Signal Arrows: Displays L (Long) or S (Short) shapes indicating validated entry zones.
B. Real-Time HUD Table Columns Explained
CORE Section:
Regime: Displays the active market state (Trending, Mean Reverting, or Random), along with the exact Hurst exponent value (H).
Wavelet: Shows wavelet alignment (Bullish, Bearish, or Flat) and active scale.
Energy: Highlights active wavelet energy surges.
LORENTZIAN Section:
Prediction: Shows the k-NN models directional bias (Bullish, Bearish, or Neutral) and its numerical score.
Confidence: Displays a loading-bar visual of neighbor similarity.
RCM Section:
State: Displays active trend states (Bullish, Bearish, or Neutral) and highlights structural damage.
Integrity: Displays a trend strength bar indicator.
Impulse / Exhaust: Compares buy/sell volume conviction and exhaustion levels.
SIGNAL Section:
Pattern / Category / Score: Shows active pattern details and its validation status.
RL Weights: Displays active category weights (O: Original, C: Candle, S: Structure, V: VSA) updated by the reinforcement learning engine.
ACTIVE TRADE Section:
Displays details of the active trade, including name, category, direction, and live unrealized profit/loss.
PERFORMANCE Section:
T1 / T2 Win Rate: Tracks performance at both Target 1 and Target 2, alongside a detailed breakdown of wins and losses by pattern category.
NARRATION Section:
Provides live commentary on structural conditions, warning you of trend transitions or consolidation phases.
STRUCTURE Section:
Displays current POC, VAH, and VAL values, indicating whether price is trading inside the Value Area or near structural siege zones.
OPTIMIZATION FOR VARIOUS TIMEFRAMES & SECTORS
A. 5-Minute Timeframe (Scalping & Order Flow Focus)
Designed to capture rapid, intraday price action and short-term liquidity pools:
Wavelet settings: Family = Haar (highest response rate to sudden price breaks), Approximation Smoothing = 2.
Lorentzian settings: K Neighbors = 3 (highly sensitive to localized historical patterns), Gamma = 0.8 (demands strict similarity matching), Outcome Delay = 5 (speeds up learning feedback).
Signal settings: Minimum Signal Score = 5 (increases trade frequency), Require Structural Proximity = true (ensures trades occur at high-probability location zones).
Asset pairings: Highly effective for high-volume stock index futures (NQ, ES), blue-chip equities (TSLA, NVDA), and liquid currency pairs (EUR/USD, GBP/USD).
B. 10-Minute Timeframe (Intraday Day Trading)
Optimized to capture midday trends while filtering out noise and false breakouts:
Wavelet settings: Family = db2 or db4, Approximation Smoothing = 4.
Lorentzian settings: K Neighbors = 5, Gamma = 1.1, Outcome Delay = 8.
Signal settings: Minimum Signal Score = 6, Require RCM Integrity ≥ 50% = true (filters out choppy consolidation ranges).
Asset pairings: Recommended for major commodity futures (Gold, Crude Oil) and high-market-cap cryptocurrency assets (BTC/USD, ETH/USD).
C. 1-Hour Timeframe (Swing Trading & Structural Position Trading)
Designed for capturing major macroeconomic trends and holding swing positions over days or weeks:
Wavelet settings: Family = sym4 or coif2 (reduces phase distortion), Approximation Smoothing = 6.
Lorentzian settings: K Neighbors = 7 or 9 (demands broad historical consensus), Gamma = 1.5, Outcome Delay = 12 or 15.
Signal settings: Minimum Signal Score = 7 (demands high confluence), Require Structural Proximity = true (requires price to be near major daily or weekly key levels).
Asset pairings: Ideal for spot forex pairs, commodity CFDs, global treasury bonds, and mid-cap equity portfolios.
* These are generalized suggestions. The main suggestion would be to play with the inputs until you find something you are comfortable with.
WEBHOOK & LIVE EXECUTION INTEGRATION BLUEPRINT
Because ⟡ CSC is an overlay indicator rather than a strategy, it utilizes specialized Pine Script `alertcondition` triggers. To bridge these signals to external brokers, prop accounts, or trade routers (such as PineConnector, 3Commas, or Capitalise.ai), you must use TradingViews dynamic placeholder tokens to pass real-time order data through your webhooks.
A. Available Indicator Alert Triggers
The script features four automated alert conditions that you can select in the TradingView alert creation menu:
- CSC Long Signal (Triggered on validated long patterns meeting all score and filter gates).
- CSC Short Signal (Triggered on validated short patterns meeting all score and filter gates).
- RCM Damage (Alerts you when structural integrity is compromised).
- Energy Surge (Alerts you when wavelet energy expands, signaling an upcoming volatility breakout).
B. Dynamic JSON Webhook Templates
By using TradingView’s Placeholder Tokens in the Alert Message box, you can pass dynamic execution data to your routing gateway:
Template 1: PineConnector (MetaTrader 4 / MetaTrader 5 Bridge)
To route trades to MT4/MT5, configure your alert message exactly as follows:
(Note: Replace (sl) and (tp) values with your preferred risk parameters or your brokers specific layout).
Template 2: 3Commas Multi-Bot Trigger
To execute signals on spot or futures crypto exchange accounts, enter the following JSON format in your Alert Message box:
Template 3: Universal Webhook JSON (For custom programmatic servers)
If you route signals to a custom API or private trading bot server, use this format to pass comprehensive market-state data:
C. Setting Up Your Webhook in TradingView
- Open the ⟡ CSC indicator settings on your chart and calibrate your inputs.
- Click the Alert icon on your TradingView menu.
- Set the Condition to Casual State Confirmation [DAFE].
- Select the desired signal condition (e.g., CSC Long Signal or CSC Short Signal).
- Set the Trigger Option to Once Per Bar Close (highly recommended to preserve k-NN and machine learning logic).
- In the Alert Actions tab, check Webhook URL and paste your gateway’s API link.
- In the Message box, paste one of the JSON templates shown above.
- Click Create.
PLATFORM COMPLIANCE & RISK DISCLAIMERS
No Guarantee of Financial Returns: This software tool is designed for educational and informational purposes only. It is not financial or investment advice. Systematic trading carries high risks of capital loss.
Hypothetical Backtesting Limitations: All performance statistics displayed in the HUD table are calculated in real time using historical data and are completely simulated. Simulated results have inherent limitations and do not represent live market transactions, brokerage fees, or execution slippage.
User Operational Responsibility: The user is solely responsible for determining position sizing, risk limits, and broker connections. ⟡ CSC is not a financial advisor. Always test Webhook JSON integrations in simulated paper-trading environments before risking live capital.
— Dskyz, Trade with insight. Trade with anticipation. (Don't follow the trend, be the trend)
สคริปต์แบบโอเพนซอร์ส
ด้วยเจตนารมณ์หลักของ TradingView ผู้สร้างสคริปต์นี้ได้ทำให้เป็นโอเพนซอร์ส เพื่อให้เทรดเดอร์สามารถตรวจสอบและยืนยันฟังก์ชันการทำงานของมันได้ ขอชื่นชมผู้เขียน! แม้ว่าคุณจะใช้งานได้ฟรี แต่โปรดจำไว้ว่าการเผยแพร่โค้ดซ้ำจะต้องเป็นไปตาม กฎระเบียบการใช้งาน ของเรา

คำจำกัดสิทธิ์ความรับผิดชอบ
ข้อมูลและบทความไม่ได้มีวัตถุประสงค์เพื่อก่อให้เกิดกิจกรรมทางการเงิน, การลงทุน, การซื้อขาย, ข้อเสนอแนะ หรือคำแนะนำประเภทอื่น ๆ ที่ให้หรือรับรองโดย TradingView อ่านเพิ่มเติมใน ข้อกำหนดการใช้งาน
สคริปต์แบบโอเพนซอร์ส
ด้วยเจตนารมณ์หลักของ TradingView ผู้สร้างสคริปต์นี้ได้ทำให้เป็นโอเพนซอร์ส เพื่อให้เทรดเดอร์สามารถตรวจสอบและยืนยันฟังก์ชันการทำงานของมันได้ ขอชื่นชมผู้เขียน! แม้ว่าคุณจะใช้งานได้ฟรี แต่โปรดจำไว้ว่าการเผยแพร่โค้ดซ้ำจะต้องเป็นไปตาม กฎระเบียบการใช้งาน ของเรา
คำจำกัดสิทธิ์ความรับผิดชอบ
ข้อมูลและบทความไม่ได้มีวัตถุประสงค์เพื่อก่อให้เกิดกิจกรรมทางการเงิน, การลงทุน, การซื้อขาย, ข้อเสนอแนะ หรือคำแนะนำประเภทอื่น ๆ ที่ให้หรือรับรองโดย TradingView อ่านเพิ่มเติมใน ข้อกำหนดการใช้งาน