tavanios BTC SMA20 Deviation Levels
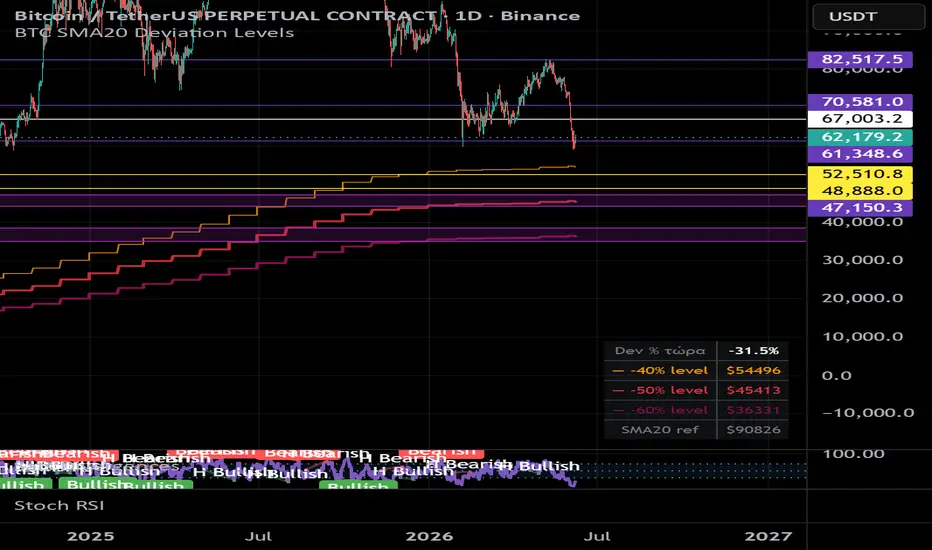
by tavanios BTC Monthly SMA20 Deviation Levels
This indicator tracks Bitcoin's deviation from its 20-month Simple Moving Average (SMA20) and plots key historical accumulation zones based on previous bear market drawdowns.
The script automatically calculates the monthly SMA20 and displays three major deviation levels:
• -40% below SMA20
• -50% below SMA20
• -60% below SMA20
These levels have historically acted as areas where Bitcoin approached long-term cycle bottoms during deep market corrections.
Features:
Automatic calculation of Bitcoin's 20-month SMA.
Visual plotting of -40%, -50%, and -60% deviation levels.
Background color zones highlighting periods of extreme undervaluation.
Real-time table displaying the current deviation percentage, SMA20 value, and corresponding accumulation levels.
Designed for long-term investors and cycle analysis.
This indicator is intended for educational and market analysis purposes only and should not be considered financial advice.
This indicator tracks Bitcoin's deviation from its 20-month Simple Moving Average (SMA20) and plots key historical accumulation zones based on previous bear market drawdowns.
The script automatically calculates the monthly SMA20 and displays three major deviation levels:
• -40% below SMA20
• -50% below SMA20
• -60% below SMA20
These levels have historically acted as areas where Bitcoin approached long-term cycle bottoms during deep market corrections.
Features:
Automatic calculation of Bitcoin's 20-month SMA.
Visual plotting of -40%, -50%, and -60% deviation levels.
Background color zones highlighting periods of extreme undervaluation.
Real-time table displaying the current deviation percentage, SMA20 value, and corresponding accumulation levels.
Designed for long-term investors and cycle analysis.
This indicator is intended for educational and market analysis purposes only and should not be considered financial advice.

คำจำกัดสิทธิ์ความรับผิดชอบ
ข้อมูลและบทความไม่ได้มีวัตถุประสงค์เพื่อก่อให้เกิดกิจกรรมทางการเงิน, การลงทุน, การซื้อขาย, ข้อเสนอแนะ หรือคำแนะนำประเภทอื่น ๆ ที่ให้หรือรับรองโดย TradingView อ่านเพิ่มเติมใน ข้อกำหนดการใช้งาน
คำจำกัดสิทธิ์ความรับผิดชอบ
ข้อมูลและบทความไม่ได้มีวัตถุประสงค์เพื่อก่อให้เกิดกิจกรรมทางการเงิน, การลงทุน, การซื้อขาย, ข้อเสนอแนะ หรือคำแนะนำประเภทอื่น ๆ ที่ให้หรือรับรองโดย TradingView อ่านเพิ่มเติมใน ข้อกำหนดการใช้งาน