HMA 9/50 Crossover + RSI 50 Filter
1. The Core Indicators
2. Entry Conditions
3. Execution & Reversal
This strategy is currently configured as an Always-in-the-Market system.
A "Long" position is automatically closed when a "Short" signal is triggered.
To prevent "pyramiding" (buying multiple positions in one direction), the script checks the current position_size before opening new entries.
How to Use
Timeframe: Optimized for 3-minute (3m) candles but can be tuned for 1m to 15m scalping.
Settings: Use the Inputs panel to adjust HMA lengths based on the volatility of your specific asset (e.g., shorter for stable stocks, longer for volatile crypto).
Visuals:
Risk Disclosure
Whipsaws: This strategy is likely to underperform in sideways markets.
Backtesting: Past performance does not guarantee future results. Always test this strategy in the Strategy Tester with appropriate commission and slippage settings before live use.
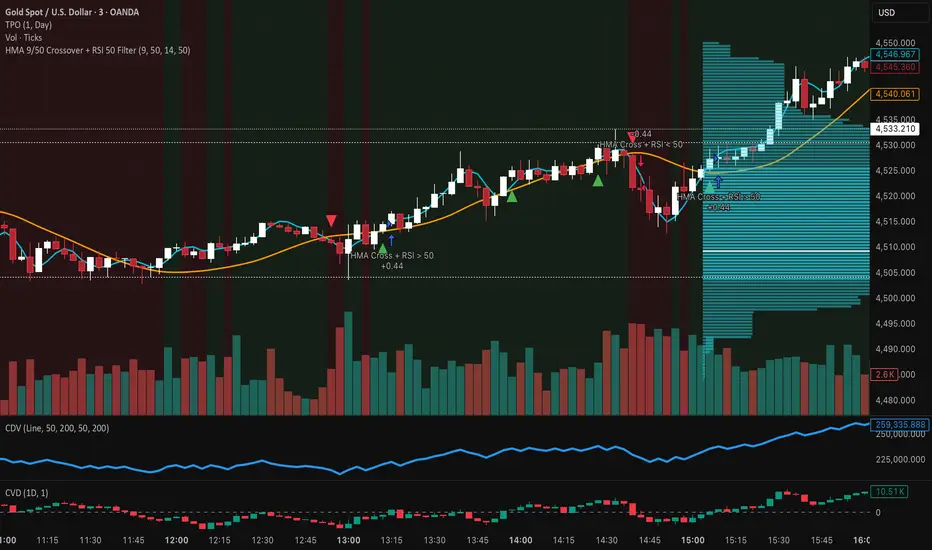
- HMA 9 (Fast): Acts as the primary trigger line. Its unique calculation minimizes lag compared to standard moving averages, allowing for faster entries.
- HMA 50 (Slow): Defines the medium-term trend direction and acts as the "anchor" for crossover signals.
- RSI 14: Serves as a "momentum gate." Instead of traditional overbought/oversold levels, we use the 50 midline to confirm that the directional strength supports the crossover.
2. Entry Conditions
- Long Entry: Triggered when the HMA 9 crosses above the HMA 50 AND the RSI is greater than 50.
- Short Entry: Triggered when the HMA 9 crosses below the HMA 50 AND the RSI is less than 50.
3. Execution & Reversal
This strategy is currently configured as an Always-in-the-Market system.
A "Long" position is automatically closed when a "Short" signal is triggered.
To prevent "pyramiding" (buying multiple positions in one direction), the script checks the current position_size before opening new entries.
How to Use
Timeframe: Optimized for 3-minute (3m) candles but can be tuned for 1m to 15m scalping.
Settings: Use the Inputs panel to adjust HMA lengths based on the volatility of your specific asset (e.g., shorter for stable stocks, longer for volatile crypto).
Visuals:
- Aqua Line: HMA 9
- Orange Line: HMA 50
- Green Background: Bullish RSI Momentum (> 50)
- Red Background: Bearish RSI Momentum (< 50)
Risk Disclosure
Whipsaws: This strategy is likely to underperform in sideways markets.
Backtesting: Past performance does not guarantee future results. Always test this strategy in the Strategy Tester with appropriate commission and slippage settings before live use.

คำจำกัดสิทธิ์ความรับผิดชอบ
ข้อมูลและบทความไม่ได้มีวัตถุประสงค์เพื่อก่อให้เกิดกิจกรรมทางการเงิน, การลงทุน, การซื้อขาย, ข้อเสนอแนะ หรือคำแนะนำประเภทอื่น ๆ ที่ให้หรือรับรองโดย TradingView อ่านเพิ่มเติมใน ข้อกำหนดการใช้งาน
คำจำกัดสิทธิ์ความรับผิดชอบ
ข้อมูลและบทความไม่ได้มีวัตถุประสงค์เพื่อก่อให้เกิดกิจกรรมทางการเงิน, การลงทุน, การซื้อขาย, ข้อเสนอแนะ หรือคำแนะนำประเภทอื่น ๆ ที่ให้หรือรับรองโดย TradingView อ่านเพิ่มเติมใน ข้อกำหนดการใช้งาน