OPEN-SOURCE SCRIPT
ที่อัปเดต: Koda Price Display
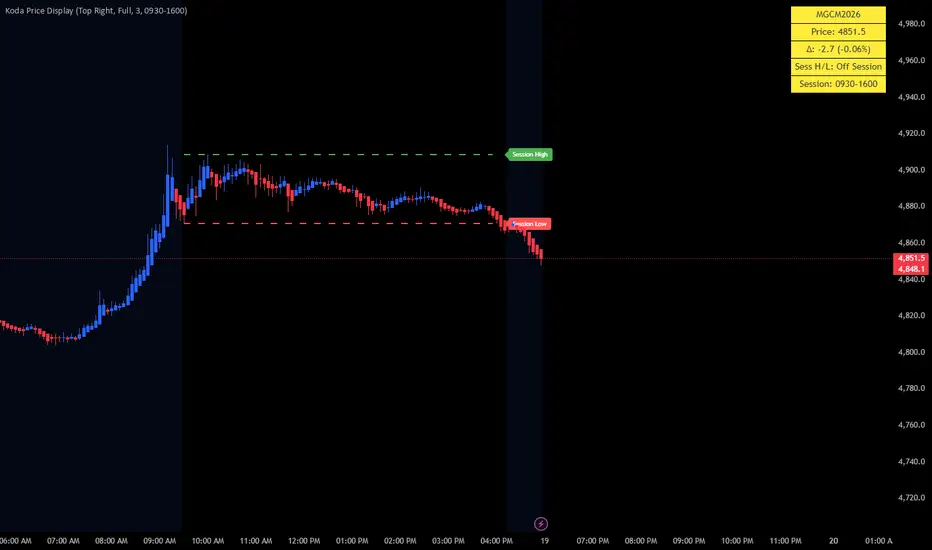
KODA PRICE DISPLAY
Koda Price Display — Complete How to Use Guide
🎯 What this indicator now does
This iindicator a real-time execution + session context tool.
It shows:
• Live price (with flashing momentum)
• Price change
• Session high & low (live updating)
• Session high/low lines on chart
• Session labels (cleanly offset)
• Movable dashboard
________________________________________
⚡ 1. Flashing Price = Micro Momentum
This is your execution timing tool
🟢 Green Flash
• Price just ticked UP
• Buyers stepping in
🔴 Red Flash
• Price just ticked DOWN
• Sellers stepping in
🟡 Yellow
• Neutral / no recent movement
________________________________________
🧠 How to use it
👉 Use flashing to confirm entries
Example:
• You want to go long
• Wait for green flashes before entering
________________________________________
💧 2. Session High & Low (Core Feature)
What it shows:
Sess H/L: 5285.00 / 5270.25
This is:
• Highest price of the session
• Lowest price of the session
________________________________________
🧠 Why this matters
These are liquidity magnets
Price often:
• Moves toward them
• Sweeps them
• Reverses from them
________________________________________
📉📈 3. Session Lines (On Chart)
🟢 Green dashed line = Session High
🔴 Red dashed line = Session Low
________________________________________
Behavior:
• Lines build during session
• Lines freeze at session end
• New session → reset
________________________________________
🧠 How to use them
🔥 1. Targets
• Long → target session high
• Short → target session low
________________________________________
🔥 2. Reversals
• Price hits session high → look for shorts
• Price hits session low → look for longs
________________________________________
🔥 3. Breakouts
• Strong break above session high → bullish continuation
• Strong break below session low → bearish continuation
________________________________________
🏷 4. Session Labels (New Upgrade)
You now see:
• Session High
• Session Low
👉 Positioned to the right of price (no overlap)
________________________________________
🧠 Why this helps
• Cleaner charts
• No confusion between levels
• Easy to identify key levels instantly
________________________________________
📍 5. Dashboard (Yellow Panel)
Always visible:
• Symbol
• Price
• Change
• Session H/L
• Session time
________________________________________
🧠 Why yellow?
• High visibility
• Doesn’t blend into chart
• Easy to read under pressure
________________________________________
🔥 6. How to Use Everything Together
🟢 Long Setup Example
1. Price near session low
2. You expect bounce
3. Watch panel:
o flashing turns green
4. Enter long
5. Target:
o session high
________________________________________
🔴 Short Setup Example
1. Price near session high
2. You expect rejection
3. Flash turns red
4. Enter short
5. Target:
o session low
________________________________________
⚠️ 7. Important Rules
❌ Don’t use flashing alone
It’s confirmation, not a signal
________________________________________
❌ Don’t ignore session levels
They are key liquidity zones
________________________________________
❌ Don’t chase breakouts blindly
Wait for:
• structure
• confirmation
• momentum
________________________________________
🧠 8. Best Use Cases
🏎 Scalping
• Use flashing + session levels
📊 Intraday trading
• Trade between session high/low
🎯 Targeting
• Use session lines as profit targets
________________________________________
🚀 9. Pro Workflow (Best Way to Use It)
Combine with your Koda BOS indicator
BOS = direction + setup
Price Display = timing + execution
________________________________________
🔥 Example:
1. BOS shows bullish setup
2. Price at session low
3. Flash turns green
4. Enter
5. Target = session high
________________________________________
🧠 Final Summary
This indicator gives you:
• ⚡ Real-time momentum (flashing)
• 💧 Liquidity levels (session high/low)
• 🎯 Targets (session lines)
• 🧭 Context (session structure)
________________________________________
🔑 Core idea:
👉 Trade from session low → session high
👉 Use flashing to time entries
Koda Price Display — Complete How to Use Guide
🎯 What this indicator now does
This iindicator a real-time execution + session context tool.
It shows:
• Live price (with flashing momentum)
• Price change
• Session high & low (live updating)
• Session high/low lines on chart
• Session labels (cleanly offset)
• Movable dashboard
________________________________________
⚡ 1. Flashing Price = Micro Momentum
This is your execution timing tool
🟢 Green Flash
• Price just ticked UP
• Buyers stepping in
🔴 Red Flash
• Price just ticked DOWN
• Sellers stepping in
🟡 Yellow
• Neutral / no recent movement
________________________________________
🧠 How to use it
👉 Use flashing to confirm entries
Example:
• You want to go long
• Wait for green flashes before entering
________________________________________
💧 2. Session High & Low (Core Feature)
What it shows:
Sess H/L: 5285.00 / 5270.25
This is:
• Highest price of the session
• Lowest price of the session
________________________________________
🧠 Why this matters
These are liquidity magnets
Price often:
• Moves toward them
• Sweeps them
• Reverses from them
________________________________________
📉📈 3. Session Lines (On Chart)
🟢 Green dashed line = Session High
🔴 Red dashed line = Session Low
________________________________________
Behavior:
• Lines build during session
• Lines freeze at session end
• New session → reset
________________________________________
🧠 How to use them
🔥 1. Targets
• Long → target session high
• Short → target session low
________________________________________
🔥 2. Reversals
• Price hits session high → look for shorts
• Price hits session low → look for longs
________________________________________
🔥 3. Breakouts
• Strong break above session high → bullish continuation
• Strong break below session low → bearish continuation
________________________________________
🏷 4. Session Labels (New Upgrade)
You now see:
• Session High
• Session Low
👉 Positioned to the right of price (no overlap)
________________________________________
🧠 Why this helps
• Cleaner charts
• No confusion between levels
• Easy to identify key levels instantly
________________________________________
📍 5. Dashboard (Yellow Panel)
Always visible:
• Symbol
• Price
• Change
• Session H/L
• Session time
________________________________________
🧠 Why yellow?
• High visibility
• Doesn’t blend into chart
• Easy to read under pressure
________________________________________
🔥 6. How to Use Everything Together
🟢 Long Setup Example
1. Price near session low
2. You expect bounce
3. Watch panel:
o flashing turns green
4. Enter long
5. Target:
o session high
________________________________________
🔴 Short Setup Example
1. Price near session high
2. You expect rejection
3. Flash turns red
4. Enter short
5. Target:
o session low
________________________________________
⚠️ 7. Important Rules
❌ Don’t use flashing alone
It’s confirmation, not a signal
________________________________________
❌ Don’t ignore session levels
They are key liquidity zones
________________________________________
❌ Don’t chase breakouts blindly
Wait for:
• structure
• confirmation
• momentum
________________________________________
🧠 8. Best Use Cases
🏎 Scalping
• Use flashing + session levels
📊 Intraday trading
• Trade between session high/low
🎯 Targeting
• Use session lines as profit targets
________________________________________
🚀 9. Pro Workflow (Best Way to Use It)
Combine with your Koda BOS indicator
BOS = direction + setup
Price Display = timing + execution
________________________________________
🔥 Example:
1. BOS shows bullish setup
2. Price at session low
3. Flash turns green
4. Enter
5. Target = session high
________________________________________
🧠 Final Summary
This indicator gives you:
• ⚡ Real-time momentum (flashing)
• 💧 Liquidity levels (session high/low)
• 🎯 Targets (session lines)
• 🧭 Context (session structure)
________________________________________
🔑 Core idea:
👉 Trade from session low → session high
👉 Use flashing to time entries
Release Note
KODA PRICE DISPLAY -Updated verions allows you to choose the siz of the Dashbaord. Koda Price Display — Complete How to Use Guide
What this indicator now does
This indicator a real-time execution + session context tool.
It shows:
• Live price (with flashing momentum)
• Price change
• Session high & low (live updating)
• Session high/low lines on chart
• Session labels (cleanly offset)
• Movable dashboard
________________________________________
1. Flashing Price = Micro Momentum
This is your execution timing tool
Green Flash
• Price just ticked UP
• Buyers stepping in
Red Flash
• Price just ticked DOWN
• Sellers stepping in
Yellow
• Neutral / no recent movement
________________________________________
How to use it
Use flashing to confirm entries
Example:
• You want to go long
• Wait for green flashes before entering
________________________________________
2. Session High & Low (Core Feature)
What it shows:
Sess H/L: 5285.00 / 5270.25
This is:
• Highest price of the session
• Lowest price of the session
________________________________________
Why this matters
These are liquidity magnets
Price often:
• Moves toward them
• Sweeps them
• Reverses from them
________________________________________
3. Session Lines (On Chart)
Green dashed line = Session High
Red dashed line = Session Low
________________________________________
Behavior:
• Lines build during session
• Lines freeze at session end
• New session → reset
________________________________________
How to use them
1. Targets
• Long → target session high
• Short → target session low
________________________________________
2. Reversals
• Price hits session high → look for shorts
• Price hits session low → look for longs
________________________________________
3. Breakouts
• Strong break above session high → bullish continuation
• Strong break below session low → bearish continuation
________________________________________
4. Session Labels (New Upgrade)
You now see:
• Session High
• Session Low
Positioned to the right of price (no overlap)
________________________________________
Why this helps
• Cleaner charts
• No confusion between levels
• Easy to identify key levels instantly
________________________________________
5. Dashboard (Yellow Panel)
Always visible:
• Symbol
• Price
• Change
• Session H/L
• Session time
________________________________________
Why yellow?
• High visibility
• Doesn’t blend into chart
• Easy to read under pressure
________________________________________
6. How to Use Everything Together
Long Setup Example
1. Price near session low
2. You expect bounce
3. Watch panel:
o flashing turns green
4. Enter long
5. Target:
o session high
________________________________________
Short Setup Example
1. Price near session high
2. You expect rejection
3. Flash turns red
4. Enter short
5. Target:
o session low
________________________________________
7. Important Rules
Don’t use flashing alone
It’s confirmation, not a signal
________________________________________
Don’t ignore session levels
They are key liquidity zones
________________________________________
Don’t chase breakouts blindly
Wait for:
• structure
• confirmation
• momentum
________________________________________
8. Best Use Cases
Scalping
• Use flashing + session levels
Intraday trading
• Trade between session high/low
Targeting
• Use session lines as profit targets
________________________________________
9. Pro Workflow (Best Way to Use It)
Combine with your Koda BOS indicator
BOS = direction + setup
Price Display = timing + execution
________________________________________
Example:
1. BOS shows bullish setup
2. Price at session low
3. Flash turns green
4. Enter
5. Target = session high
________________________________________
Final Summary
This indicator gives you:
• Real-time momentum (flashing)
• Liquidity levels (session high/low)
• Targets (session lines)
• Context (session structure)
________________________________________
Core idea:
Trade from session low → session high
Use flashing to time entries
สคริปต์แบบโอเพนซอร์ส
ด้วยเจตนารมณ์หลักของ TradingView ผู้สร้างสคริปต์นี้ได้ทำให้เป็นโอเพนซอร์ส เพื่อให้เทรดเดอร์สามารถตรวจสอบและยืนยันฟังก์ชันการทำงานของมันได้ ขอชื่นชมผู้เขียน! แม้ว่าคุณจะใช้งานได้ฟรี แต่โปรดจำไว้ว่าการเผยแพร่โค้ดซ้ำจะต้องเป็นไปตาม กฎระเบียบการใช้งาน ของเรา

คำจำกัดสิทธิ์ความรับผิดชอบ
ข้อมูลและบทความไม่ได้มีวัตถุประสงค์เพื่อก่อให้เกิดกิจกรรมทางการเงิน, การลงทุน, การซื้อขาย, ข้อเสนอแนะ หรือคำแนะนำประเภทอื่น ๆ ที่ให้หรือรับรองโดย TradingView อ่านเพิ่มเติมใน ข้อกำหนดการใช้งาน
สคริปต์แบบโอเพนซอร์ส
ด้วยเจตนารมณ์หลักของ TradingView ผู้สร้างสคริปต์นี้ได้ทำให้เป็นโอเพนซอร์ส เพื่อให้เทรดเดอร์สามารถตรวจสอบและยืนยันฟังก์ชันการทำงานของมันได้ ขอชื่นชมผู้เขียน! แม้ว่าคุณจะใช้งานได้ฟรี แต่โปรดจำไว้ว่าการเผยแพร่โค้ดซ้ำจะต้องเป็นไปตาม กฎระเบียบการใช้งาน ของเรา
คำจำกัดสิทธิ์ความรับผิดชอบ
ข้อมูลและบทความไม่ได้มีวัตถุประสงค์เพื่อก่อให้เกิดกิจกรรมทางการเงิน, การลงทุน, การซื้อขาย, ข้อเสนอแนะ หรือคำแนะนำประเภทอื่น ๆ ที่ให้หรือรับรองโดย TradingView อ่านเพิ่มเติมใน ข้อกำหนดการใช้งาน