OPEN-SOURCE SCRIPT
Sloped LinReg Volume Profile [MarkitTick]
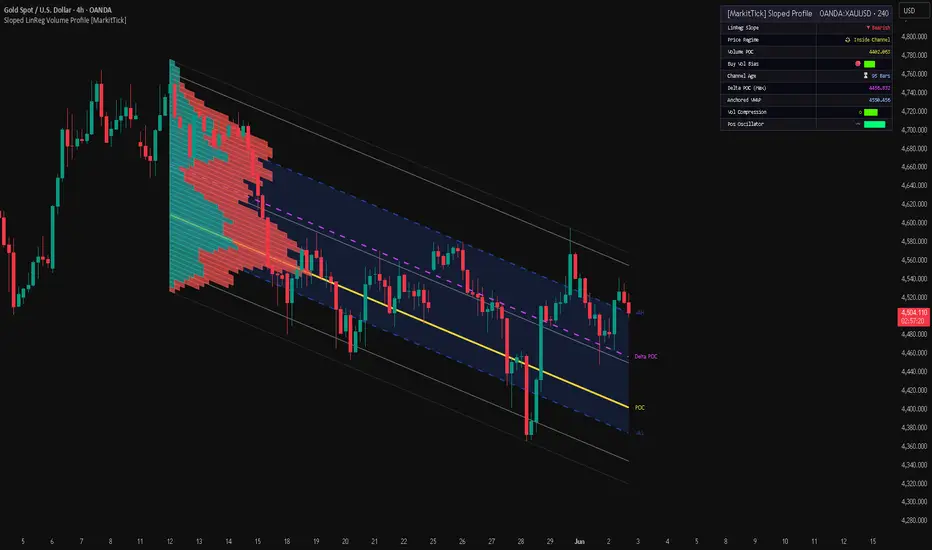
💡 This indicator introduces a highly dynamic approach to volume and price analysis by merging standard volume principles with vector-based linear regression. Rather than plotting volume distributions on a static horizontal plane, this tool maps volume nodes parallel to the prevailing mathematical trend. By constructing a localized volume profile that follows the trajectory of price action, it captures momentum-adjusted value areas, providing an advanced lens for interpreting market geometry, support/resistance, and volume anomalies. It is strictly engineered for standard candlestick charts, specifically excluding non-standard formats to ensure pristine volume and price data integrity.
● ✨ Originality and Utility
Standard volume profiles aggregate historical volume at fixed price levels, which often creates fragmented or obsolete value nodes when a market is actively trending. This indicator resolves that structural limitation by angling the volume bins to match the slope of a linear regression channel.
● 🔬 Methodology and Concepts
The foundational logic relies on computing a rolling linear regression to establish a baseline trajectory over a specified period. The methodology relies on Pine Script's time-series event loop, evaluating arrays of data dynamically as new bars form.
● 🎨 Visual Guide
Every visual element is rendered utilizing Pine Script's advanced drawing arrays and is fully user-configurable to support dark-mode analytical environments.
• The Sloped Profile
• Channel and Level Lines
• Analytics Dashboard
● 📖 How to Use
The indicator serves as a complete environmental map for trending markets.
● ⚙️ Inputs and Settings
• Linear Regression Settings
• Sloped Volume Profile Settings
• Advanced Quant Analytics
⚠️ Disclaimer
All provided scripts and indicators are strictly for educational exploration and must not be interpreted as financial advice or a recommendation to execute trades. I expressly disclaim all liability for any financial losses or damages that may result, directly or indirectly, from the reliance on or application of these tools. Market participation carries inherent risk where past performance never guarantees future returns, leaving all investment decisions and due diligence solely at your own discretion.
● ✨ Originality and Utility
Standard volume profiles aggregate historical volume at fixed price levels, which often creates fragmented or obsolete value nodes when a market is actively trending. This indicator resolves that structural limitation by angling the volume bins to match the slope of a linear regression channel.
- It identifies where volume is concentrated relative to the trend's axis, not just the absolute price.
- It reveals volume-weighted momentum, highlighting whether buying or selling pressure is accelerating in the direction of the regression slope.
- The tool includes an integrated, dark-mode optimized analytics dashboard that processes quantitative metrics natively on the chart without requiring secondary oscillators.
● 🔬 Methodology and Concepts
The foundational logic relies on computing a rolling linear regression to establish a baseline trajectory over a specified period. The methodology relies on Pine Script's time-series event loop, evaluating arrays of data dynamically as new bars form.
- Vector-Based Binning: Instead of horizontal rows, the profile utilizes a dynamic upper and lower deviation band. The mathematical distance between these bands is partitioned into a user-defined number of rows.
- Volume Distribution: As the script loops through the historical lookback window, it evaluates the volume of each bar. The volume is divided proportionally across the sloped bins that intersect the bar's high-low range.
- Directional Volume (Delta): Each bin further categorizes volume into "Buy" or "Sell" categories based on whether the bar's closing price was greater than or equal to its opening price.
- Value Area Calculation: The Point of Control (POC) identifies the sloped bin with the highest total volume. The Value Area High (VAH) and Value Area Low (VAL) expand outward from the POC until they encapsulate a specific percentage of the total allocated volume, dynamically updating as price action develops.
● 🎨 Visual Guide
Every visual element is rendered utilizing Pine Script's advanced drawing arrays and is fully user-configurable to support dark-mode analytical environments.
• The Sloped Profile
- Volume Bars: Rendered as polygons extending inward from the right side of the channel. The length of each polygon represents the relative volume allocated to that specific standard deviation bin.
- Color Coding: Bullish volume defaults to a translucent teal, while bearish volume displays as a translucent red. Bins experiencing extraordinary volume influxes override with a bright, high-visibility color to highlight anomalous market participation.
• Channel and Level Lines
- Regression Bounds: Solid or semi-transparent lines mapping the start and end of the regression channel, defining the upper and lower standard deviation extremes.
- POC Line: A thick, solid yellow line plotting the Point of Control across the length of the channel.
- Value Area Lines: Dashed blue lines tracking the VAH and VAL. The area between these lines is shaded with a deep blue fill to instantly highlight the trend's core acceptance zone.
- Delta POC: A dashed fuchsia line identifying the bin with the most extreme difference between buying and selling volume.
• Analytics Dashboard
- Located in the top right, this table provides real-time quantitative readouts formatted to precise tick values.
- LinReg Slope: Indicates the mathematical direction of the trend (Bullish/Bearish).
- Price Regime: Identifies if the current close is inside the channel or breaking the upper/lower bounds.
- Volume POC & Delta POC: Displays the exact price equivalents of the sloped control lines at the current bar index.
- Buy Vol Bias: A visual progress bar detailing the ratio of bullish to bearish volume within the regression window.
- Vol Compression: Evaluates the density of the value area. A highly concentrated value area yields a higher compression score.
● 📖 How to Use
The indicator serves as a complete environmental map for trending markets.
- Trend Qualification: Utilize the slope of the regression channel to establish the primary directional bias. Trades should ideally align with the slope.
- Value Area Rejections: The VAH and VAL lines function as dynamic support and resistance. A price action rejection at the VAH within a downward-sloping channel offers a high-probability continuation setup.
- POC Magnetism: Price will naturally gravitate toward the sloped POC. Deviations far outside the Value Area typically mean-revert to the POC unless accompanied by a severe volume imbalance.
- Interpreting Delta: Compare the traditional POC to the Delta POC. If the Delta POC rests significantly higher or lower than the overall Volume POC, it indicates an aggressive concentration of directional absorption (trapped buyers or sellers).
- Repainting Warning: Because this indicator calculates a dynamic linear regression over a moving lookback window, the visual placement of the channel and profile will continually recalculate and shift on the real-time bar until the bar closes. This is standard behavior for dynamic geometric overlays, but users should wait for bar confirmation before executing trades based on channel interactions.
● ⚙️ Inputs and Settings
• Linear Regression Settings
- Channel Length: Defines the historical lookback window (default is 100). Higher values create smoother, macro-trend profiles.
- Source: The price data used for the regression calculation (Open, High, Low, Close, HL2, HLC3, OHLC4).
- Upper/Lower Deviation: Toggles the outer bounds of the channel and sets the standard deviation multipliers.
• Sloped Volume Profile Settings
- Number of Rows: The granularity of the profile. More rows create thinner, more precise volume nodes.
- Profile Width %: Determines how far the volume polygons stretch across the screen relative to the channel length.
- Value Area %: The percentage of total volume to include within the VAH and VAL bounds (default 70%).
• Advanced Quant Analytics
- Highlight Footprints: Visually isolates volume bins that exceed two standard deviations above the mean bin volume.
- Calculate Anchored VWAP: Toggles the inclusion of an Anchored VWAP (anchored to the start of the regression window) within the dashboard matrix.
⚠️ Disclaimer
All provided scripts and indicators are strictly for educational exploration and must not be interpreted as financial advice or a recommendation to execute trades. I expressly disclaim all liability for any financial losses or damages that may result, directly or indirectly, from the reliance on or application of these tools. Market participation carries inherent risk where past performance never guarantees future returns, leaving all investment decisions and due diligence solely at your own discretion.
สคริปต์แบบโอเพนซอร์ส
ด้วยเจตนารมณ์หลักของ TradingView ผู้สร้างสคริปต์นี้ได้ทำให้เป็นโอเพนซอร์ส เพื่อให้เทรดเดอร์สามารถตรวจสอบและยืนยันฟังก์ชันการทำงานของมันได้ ขอชื่นชมผู้เขียน! แม้ว่าคุณจะใช้งานได้ฟรี แต่โปรดจำไว้ว่าการเผยแพร่โค้ดซ้ำจะต้องเป็นไปตาม กฎระเบียบการใช้งาน ของเรา

💡 Proprietary indicators. Original research. Built by analysts who trade.
📢 Free Telegram: t.me/MarkitTick_Updates
👑 Premium: markittick.com
📢 Free Telegram: t.me/MarkitTick_Updates
👑 Premium: markittick.com
คำจำกัดสิทธิ์ความรับผิดชอบ
ข้อมูลและบทความไม่ได้มีวัตถุประสงค์เพื่อก่อให้เกิดกิจกรรมทางการเงิน, การลงทุน, การซื้อขาย, ข้อเสนอแนะ หรือคำแนะนำประเภทอื่น ๆ ที่ให้หรือรับรองโดย TradingView อ่านเพิ่มเติมใน ข้อกำหนดการใช้งาน
สคริปต์แบบโอเพนซอร์ส
ด้วยเจตนารมณ์หลักของ TradingView ผู้สร้างสคริปต์นี้ได้ทำให้เป็นโอเพนซอร์ส เพื่อให้เทรดเดอร์สามารถตรวจสอบและยืนยันฟังก์ชันการทำงานของมันได้ ขอชื่นชมผู้เขียน! แม้ว่าคุณจะใช้งานได้ฟรี แต่โปรดจำไว้ว่าการเผยแพร่โค้ดซ้ำจะต้องเป็นไปตาม กฎระเบียบการใช้งาน ของเรา
💡 Proprietary indicators. Original research. Built by analysts who trade.
📢 Free Telegram: t.me/MarkitTick_Updates
👑 Premium: markittick.com
📢 Free Telegram: t.me/MarkitTick_Updates
👑 Premium: markittick.com
คำจำกัดสิทธิ์ความรับผิดชอบ
ข้อมูลและบทความไม่ได้มีวัตถุประสงค์เพื่อก่อให้เกิดกิจกรรมทางการเงิน, การลงทุน, การซื้อขาย, ข้อเสนอแนะ หรือคำแนะนำประเภทอื่น ๆ ที่ให้หรือรับรองโดย TradingView อ่านเพิ่มเติมใน ข้อกำหนดการใช้งาน