OPEN-SOURCE SCRIPT
ที่อัปเดต: TPI 15m ONLY
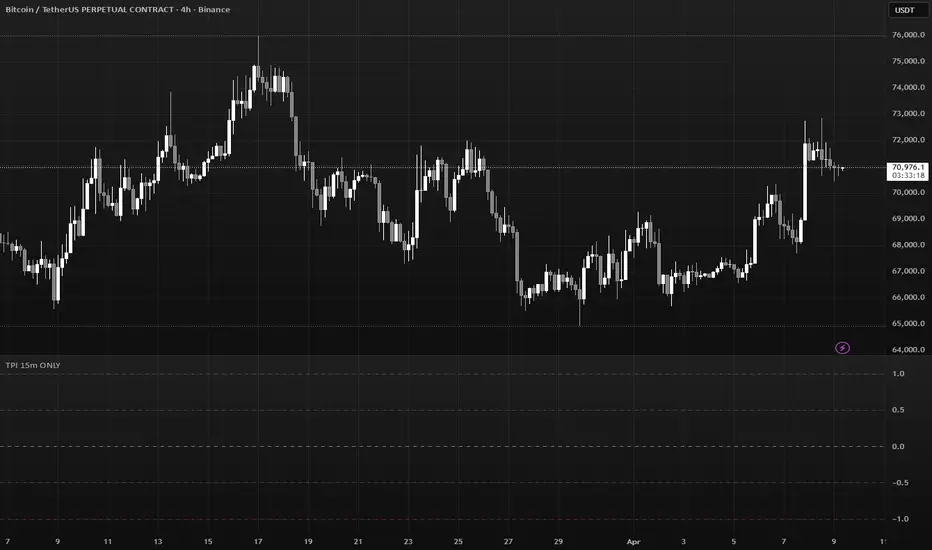
TPI (Trend Power Index) is a multi-factor momentum and structure indicator designed to measure overall market bias using trend structure, momentum, and moving averages.
The script combines six independent components into one normalized score between -1 and +1, giving a quick visual overview of bullish or bearish strength.
The indicator is optimized to work with 15 minute trading, while also incorporating higher timeframe structure.
Core Components
1. Multi-Timeframe Market Structure (BOS / MSB)
The script builds dynamic swing highs and swing lows and detects:
BOS (Break of Structure)
MSB (Market Structure Break)
These signals determine the trend direction on:
4H
1H
15M
Each timeframe contributes to the final trend score.
2. Supertrend Bias (30m)
A 30 minute Supertrend is used as a higher timeframe trend filter.
Price above Supertrend → Bullish score
Price below Supertrend → Bearish score
3. TSI Momentum (15m)
A True Strength Index measures momentum strength.
Conditions used:
TSI above signal line
TSI above or below zero
This creates graded momentum scoring.
4. EMA Structure (15m)
Two EMAs are used:
EMA 18
EMA 36
Scoring depends on:
EMA alignment
Price position relative to both EMAs
This captures short-term directional pressure.
Final TPI Calculation
All components are averaged:
TPI = (4H trend + 1H trend + 15M trend + TSI + EMA + Supertrend) / 6
The result is a continuous score between -1 and +1.
Visualization
The indicator plots colored dots representing trend strength.
Color intensity reflects the magnitude of the TPI score:
Dark Green → Strong bullish alignment
Light Green → Mild bullish bias
Gray → Neutral / mixed signals
Light Red → Mild bearish bias
Dark Red → Strong bearish alignment
Horizontal reference levels:
+1.0 → Maximum bullish alignment
+0.5 → Moderate bullish bias
0.0 → Neutral
-0.5 → Moderate bearish bias
-1.0 → Maximum bearish alignment
Intended Use
TPI is designed to help traders quickly identify:
Market alignment across timeframes
Momentum confirmation
Trend strength
Potential trend transitions
It works well as a trend filter, bias indicator, or confirmation tool for discretionary strategies.
The script combines six independent components into one normalized score between -1 and +1, giving a quick visual overview of bullish or bearish strength.
The indicator is optimized to work with 15 minute trading, while also incorporating higher timeframe structure.
Core Components
1. Multi-Timeframe Market Structure (BOS / MSB)
The script builds dynamic swing highs and swing lows and detects:
BOS (Break of Structure)
MSB (Market Structure Break)
These signals determine the trend direction on:
4H
1H
15M
Each timeframe contributes to the final trend score.
2. Supertrend Bias (30m)
A 30 minute Supertrend is used as a higher timeframe trend filter.
Price above Supertrend → Bullish score
Price below Supertrend → Bearish score
3. TSI Momentum (15m)
A True Strength Index measures momentum strength.
Conditions used:
TSI above signal line
TSI above or below zero
This creates graded momentum scoring.
4. EMA Structure (15m)
Two EMAs are used:
EMA 18
EMA 36
Scoring depends on:
EMA alignment
Price position relative to both EMAs
This captures short-term directional pressure.
Final TPI Calculation
All components are averaged:
TPI = (4H trend + 1H trend + 15M trend + TSI + EMA + Supertrend) / 6
The result is a continuous score between -1 and +1.
Visualization
The indicator plots colored dots representing trend strength.
Color intensity reflects the magnitude of the TPI score:
Dark Green → Strong bullish alignment
Light Green → Mild bullish bias
Gray → Neutral / mixed signals
Light Red → Mild bearish bias
Dark Red → Strong bearish alignment
Horizontal reference levels:
+1.0 → Maximum bullish alignment
+0.5 → Moderate bullish bias
0.0 → Neutral
-0.5 → Moderate bearish bias
-1.0 → Maximum bearish alignment
Intended Use
TPI is designed to help traders quickly identify:
Market alignment across timeframes
Momentum confirmation
Trend strength
Potential trend transitions
It works well as a trend filter, bias indicator, or confirmation tool for discretionary strategies.
Release Note
.Release Note
Contact me in private if you need the indicatorRelease Note
Contact me in private if you need the indicatorสคริปต์แบบโอเพนซอร์ส
ด้วยเจตนารมณ์หลักของ TradingView ผู้สร้างสคริปต์นี้ได้ทำให้เป็นโอเพนซอร์ส เพื่อให้เทรดเดอร์สามารถตรวจสอบและยืนยันฟังก์ชันการทำงานของมันได้ ขอชื่นชมผู้เขียน! แม้ว่าคุณจะใช้งานได้ฟรี แต่โปรดจำไว้ว่าการเผยแพร่โค้ดซ้ำจะต้องเป็นไปตาม กฎระเบียบการใช้งาน ของเรา

คำจำกัดสิทธิ์ความรับผิดชอบ
ข้อมูลและบทความไม่ได้มีวัตถุประสงค์เพื่อก่อให้เกิดกิจกรรมทางการเงิน, การลงทุน, การซื้อขาย, ข้อเสนอแนะ หรือคำแนะนำประเภทอื่น ๆ ที่ให้หรือรับรองโดย TradingView อ่านเพิ่มเติมใน ข้อกำหนดการใช้งาน
สคริปต์แบบโอเพนซอร์ส
ด้วยเจตนารมณ์หลักของ TradingView ผู้สร้างสคริปต์นี้ได้ทำให้เป็นโอเพนซอร์ส เพื่อให้เทรดเดอร์สามารถตรวจสอบและยืนยันฟังก์ชันการทำงานของมันได้ ขอชื่นชมผู้เขียน! แม้ว่าคุณจะใช้งานได้ฟรี แต่โปรดจำไว้ว่าการเผยแพร่โค้ดซ้ำจะต้องเป็นไปตาม กฎระเบียบการใช้งาน ของเรา
คำจำกัดสิทธิ์ความรับผิดชอบ
ข้อมูลและบทความไม่ได้มีวัตถุประสงค์เพื่อก่อให้เกิดกิจกรรมทางการเงิน, การลงทุน, การซื้อขาย, ข้อเสนอแนะ หรือคำแนะนำประเภทอื่น ๆ ที่ให้หรือรับรองโดย TradingView อ่านเพิ่มเติมใน ข้อกำหนดการใช้งาน