MTF VWAP Z-Score (nvkanade)
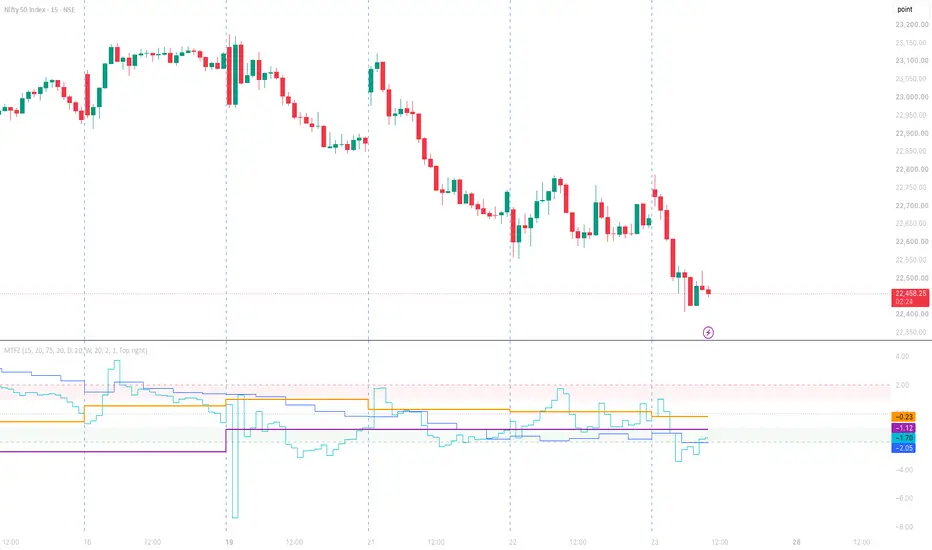
MTF VWAP Z-Score (15m / 75m / Day / Week): non-repainting
OVERVIEW
This indicator shows, in one pane, how stretched price is on four timeframes at once: by default 15 minutes, 75 minutes, Day and Week. A short panel then sums up the combined picture in plain language.
A Z-score answers one question: how unusual is the latest close compared with recent trading? It is the distance between the close and its recent volume-weighted average, measured in standard deviations (σ).
- +2 means the close is two standard deviations above where most recent volume traded.
- −2 means two below.
- 0 means price is at its average.
HOW IT IS CALCULATED
- For each timeframe, the average and σ are volume-weighted over the previous N bars (default 20).
- The bar being scored is left out of its own average. If it were included, it would cap how far the Z-score can go (with 5 bars, a close can hardly ever be more than about 2σ from an average that contains it). Leaving it out gives an uncapped "how unusual is this close" reading.
- σ can include each bar's own high–low range, (high − low)² / 12. Without it, volatility is understated when bars are wide but their closes are similar.
- Price is the typical price, (high + low + close) / 3.
- Symbols without volume data (many indices) fall back to equal weights.
NON-REPAINTING
- By default, each timeframe shows the value of its last COMPLETED bar. Once a bar has closed, its value never changes, so the history you see is what was visible in real time.
- The trade-off is a lag. During today's session, for example, the Day line shows yesterday's completed value.
- A setting shows the developing bar instead. That version updates live and therefore repaints.
- A timeframe lower than the chart's timeframe shows as "—". To see all four lines, use a chart of 15 minutes or lower.
THE SUMMARY PANEL
The panel lists each timeframe's Z-score with a reading: Extreme high, High, Neutral, Low or Extreme low. A headline then combines them:
- The higher timeframes (Day, Week) set the backdrop. Both above their averages = uptrend; both below = downtrend; otherwise mixed.
- The lower timeframes (15m, 75m) show the short-term stretch.
Headlines (the extreme level is 2σ by default):
- Dip in an uptrend: higher timeframes up, a lower timeframe at or below the −extreme level. A short-term washout inside an uptrend.
- Rally in a downtrend: higher timeframes down, a lower timeframe at or above the +extreme level.
- Uptrend, short-term hot / Downtrend, short-term flush: a short-term stretch in the same direction as the trend.
- Overstretched up / down: every timeframe beyond the extreme level.
- Uptrend / Downtrend: a clear backdrop, with the lower timeframes calm.
- Mixed / No clear setup: the higher timeframes disagree.
HOW IT CAN HELP
- Timing pullbacks in a trend: wait for "Dip in an uptrend" instead of buying when every timeframe is already stretched up. The same applies in reverse for shorts.
- Not chasing moves: "Overstretched" warns that a move is extended on every horizon at once.
- Checking context: see whether your own entry signal agrees with the higher-timeframe backdrop.
- Comparing markets: Z-scores are in σ units, so a reading means the same on a large-cap stock, an index future or a currency pair.
COLOURS
Red shading = stretched above average; green = stretched below. The colours describe stretch. They are not buy or sell calls.
SETTINGS
- Four timeframes and their lookbacks (in bars).
- Extreme and mild levels (default 2σ and 1σ).
- Include each bar's high–low range in σ (on by default).
- Show the developing bar (off by default; repaints when on).
- Panel position and line colours.
ALERTS
Two alert conditions, "Dip in an uptrend" and "Rally in a downtrend", fire when the condition first appears on a completed bar.
NOTES AND LIMITATIONS
- The 75-minute default suits NSE's 09:15–15:30 session (five bars a day). For other markets, pick timeframes that fit their session.
- Higher-timeframe lines move only when their bar closes, so they step rather than move smoothly.
- The panel describes the current situation. It is not a tested trading system: treat the readings as context, not signals, and use your own risk management.

คำจำกัดสิทธิ์ความรับผิดชอบ
ข้อมูลและบทความไม่ได้มีวัตถุประสงค์เพื่อก่อให้เกิดกิจกรรมทางการเงิน, การลงทุน, การซื้อขาย, ข้อเสนอแนะ หรือคำแนะนำประเภทอื่น ๆ ที่ให้หรือรับรองโดย TradingView อ่านเพิ่มเติมใน ข้อกำหนดการใช้งาน
คำจำกัดสิทธิ์ความรับผิดชอบ
ข้อมูลและบทความไม่ได้มีวัตถุประสงค์เพื่อก่อให้เกิดกิจกรรมทางการเงิน, การลงทุน, การซื้อขาย, ข้อเสนอแนะ หรือคำแนะนำประเภทอื่น ๆ ที่ให้หรือรับรองโดย TradingView อ่านเพิ่มเติมใน ข้อกำหนดการใช้งาน