ICT Unicorn Model, Breaker Block & FVG Zone [LunqFX]
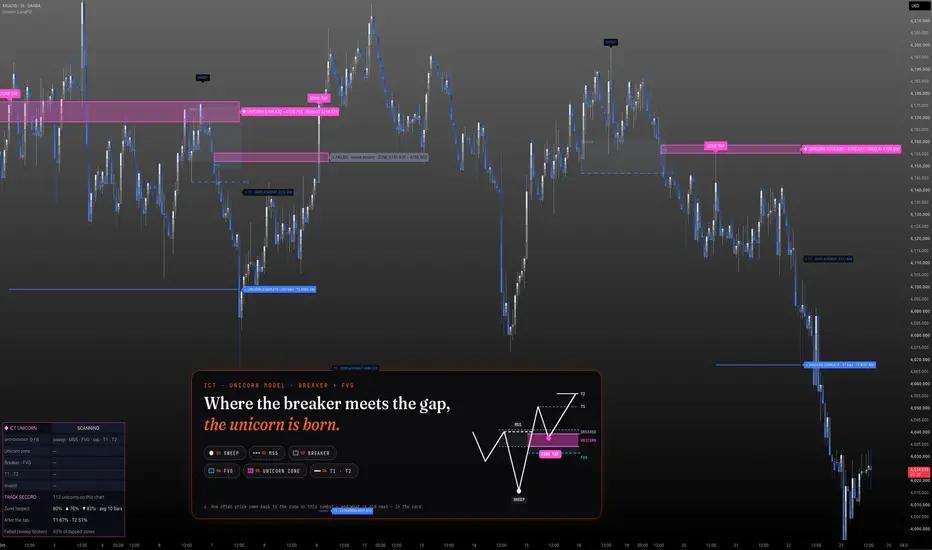
ICT Unicorn Model finds the ICT unicorn setup, one of the best-known smart money concepts (SMC) models: a liquidity sweep, a market structure shift (MSS) that turns the last opposite candle into a breaker block, and a fair value gap (FVG) from the same displacement that overlaps that breaker. The overlap is the unicorn zone. The script draws the breaker, the FVG and the zone, then follows what price does with it — whether it comes back into the zone, and from there whether it reaches the targets or the sweep gives way — and keeps the score on this symbol.
Unicorn model indicators mark the zone and stop there. Whether price ever returns to it, how long that takes, and how often the move continues from it are left to guesswork. This one runs every unicorn to its end and shows the record in a card on the chart: how many zones formed, the share that was tapped, the average wait, and after the tap, how often T1 and T2 were reached and how often the model failed. You see whether the unicorn is worth waiting for on this market before you wait for it.
❶ THE UNICORN, STEP BY STEP ① SWEEP — a swing runs beyond the previous swing on the same side, taking the liquidity resting there (sell-side for a bullish unicorn, buy-side for a bearish one). ② MSS — price closes through the swing between the two. The structure has shifted. ③ BREAKER BLOCK — the last opposite-close candle at the swing that was broken (the last up-close candle at the high for a bullish unicorn, the last down-close candle at the low for a bearish one). After the MSS it acts as support or resistance. ④ FVG — a fair value gap printed by the displacement through the structure. The unicorn needs the gap to overlap the breaker; a gap printed within a few bars after the MSS still counts. ⑤ UNICORN ZONE — the overlap of the breaker and the FVG, drawn in pink. Overlaps thinner than a set fraction of ATR are ignored: a sliver that price runs straight through is not a zone. ⑥ ZONE TAP → T1 / T2 — price comes back into the zone, then the targets. If the MSS prints no overlapping FVG within the window, there is no unicorn and nothing is drawn.
❷ LEVELS ▸ UNICORN ZONE — breaker ∩ FVG, with the breaker (grey, dotted) and the FVG (cyan, dashed) drawn underneath ▸ T1 · DISPLACEMENT — the furthest point of the move away from the zone before the tap ▸ T2 · EXTENSION — half of the sweep-to-displacement leg beyond T1 ▸ INVALID — a close back beyond the sweep extreme, the level ICT places the stop behind. It applies before and after the tap, and once the zone is tapped it is shown in the zone label. Each target gets a ✓ when it trades. The result is written into the model's own labels, so nothing floats loose on the chart: a completed unicorn turns its T2 label into "✓ UNICORN COMPLETE · bars", and any other ending — FAILED · sweep broken (after the tap), SWEEP BROKEN · no tap, EXPIRED, or ZONE MISSED (price never came back within the waiting window) — is written into the zone label.
❸ THE CARD A compact card at the bottom left of the chart, clear of the symbol legend: ▸ Status — SCANNING, MSS · LOOKING FOR FVG, ZONE ARMED, IN ZONE, or T1 ✓ · RUNNING, coloured by direction ▸ Progress bar — ▰▰▰▱▱▱ over the six steps: sweep · MSS · FVG · tap · T1 · T2 ▸ The unicorn zone and how many ATR price is away from it while you wait ▸ Breaker and FVG ranges, T1 and T2, and the invalidation level ▸ Track record — unicorns formed on this chart, the share tapped (bullish and bearish separately), the average bars to the tap, and after the tap the share that reached T1 and T2 and the share that failed with the sweep broken
❹ HOW TO USE IT
A new unicorn appears when the overlapping FVG is found. The zone, the breaker and the FVG are drawn, and the card shows how far price is from the zone.
Check the track record: if zones are rarely tapped on this symbol, a missed retest is normal here.
When price taps the zone, T1, T2 and the invalidation level are drawn. Use your own entry rules for timing and risk.
A sweep into a higher-timeframe level (an old high or low, an order block) is the classic ICT context for a unicorn; that context is part of your own smart money concepts analysis.
Works on forex, gold (XAUUSD), index CFDs and crypto, from 1 minute to the daily chart.
❺ SETTINGS Model ▸ Swing strength — bars on each side that confirm a swing; higher finds bigger, fewer models ▸ Min. liquidity sweep (× ATR) — how far the sweep must run beyond the previous swing ▸ Bars to find the FVG after the MSS — how long the displacement may keep printing the overlapping gap ▸ Min. unicorn zone height (× ATR) — thinner overlaps of breaker and gap are not counted ▸ Bars to wait for the zone tap · Bars after the tap Drawing ▸ Breaker and FVG boxes — show the two parts under the unicorn zone, or the zone alone ▸ Sweep and MSS · Targets and invalidation ▸ Models drawn — how many finished models stay on the chart; the track record keeps all of them ▸ Label size Card ▸ Show card · position (bottom left by default, or any corner) · text size Alerts ▸ Unicorn zone formed · Zone tapped · Target hit / failed Visuals ▸ Neon candles — ice white rising, royal blue falling; the unicorn zone in neon pink. Off = your own chart candles. ▸ Glow candles — each body brightens towards the close. Off = flat neon bodies.
❻ ALERTS ▸ Unicorn zone formed — with the zone ▸ Zone tapped — with T1, T2 and the invalidation level ▸ Target hit, model failed (close beyond the sweep) Create the alert with "Any alert() function call" for the full messages, or use the four alert conditions.
❼ NON-REPAINTING Swings are confirmed pivots, so a sweep is known "swing strength" bars after the swing forms — the model is never drawn before its parts exist. The MSS, the zone, the tap, target hits and failures are decided on closed bars, and no drawing is moved back in time. The script does not use request.security or lookahead.
LIMITATIONS ▸ Swing confirmation delays the model: the MSS can only be registered once the sweep is a confirmed swing, so in a fast move the zone can appear a few bars after price crossed the structure. ▸ The breaker is taken as the last opposite-close candle at the broken swing, and the unicorn needs an FVG that overlaps it. Other traders mark breakers and gaps by eye and may disagree on some of them. ▸ One model is tracked at a time; a unicorn that forms while another is running is not tracked. ▸ The track record covers only the history loaded on your chart, and the "zone tapped" share also counts zones that are still waiting. Small samples are noisy — check how many unicorns formed before trusting a percentage. Past rates are not a forecast. ▸ The model gives a zone, targets and an invalidation level — not an entry. It has no stop loss or position sizing; combine it with your own entry rules and risk management.
This script is for educational purposes only and is not financial advice. Trading involves risk.
Unicorn model indicators mark the zone and stop there. Whether price ever returns to it, how long that takes, and how often the move continues from it are left to guesswork. This one runs every unicorn to its end and shows the record in a card on the chart: how many zones formed, the share that was tapped, the average wait, and after the tap, how often T1 and T2 were reached and how often the model failed. You see whether the unicorn is worth waiting for on this market before you wait for it.
❶ THE UNICORN, STEP BY STEP ① SWEEP — a swing runs beyond the previous swing on the same side, taking the liquidity resting there (sell-side for a bullish unicorn, buy-side for a bearish one). ② MSS — price closes through the swing between the two. The structure has shifted. ③ BREAKER BLOCK — the last opposite-close candle at the swing that was broken (the last up-close candle at the high for a bullish unicorn, the last down-close candle at the low for a bearish one). After the MSS it acts as support or resistance. ④ FVG — a fair value gap printed by the displacement through the structure. The unicorn needs the gap to overlap the breaker; a gap printed within a few bars after the MSS still counts. ⑤ UNICORN ZONE — the overlap of the breaker and the FVG, drawn in pink. Overlaps thinner than a set fraction of ATR are ignored: a sliver that price runs straight through is not a zone. ⑥ ZONE TAP → T1 / T2 — price comes back into the zone, then the targets. If the MSS prints no overlapping FVG within the window, there is no unicorn and nothing is drawn.
❷ LEVELS ▸ UNICORN ZONE — breaker ∩ FVG, with the breaker (grey, dotted) and the FVG (cyan, dashed) drawn underneath ▸ T1 · DISPLACEMENT — the furthest point of the move away from the zone before the tap ▸ T2 · EXTENSION — half of the sweep-to-displacement leg beyond T1 ▸ INVALID — a close back beyond the sweep extreme, the level ICT places the stop behind. It applies before and after the tap, and once the zone is tapped it is shown in the zone label. Each target gets a ✓ when it trades. The result is written into the model's own labels, so nothing floats loose on the chart: a completed unicorn turns its T2 label into "✓ UNICORN COMPLETE · bars", and any other ending — FAILED · sweep broken (after the tap), SWEEP BROKEN · no tap, EXPIRED, or ZONE MISSED (price never came back within the waiting window) — is written into the zone label.
❸ THE CARD A compact card at the bottom left of the chart, clear of the symbol legend: ▸ Status — SCANNING, MSS · LOOKING FOR FVG, ZONE ARMED, IN ZONE, or T1 ✓ · RUNNING, coloured by direction ▸ Progress bar — ▰▰▰▱▱▱ over the six steps: sweep · MSS · FVG · tap · T1 · T2 ▸ The unicorn zone and how many ATR price is away from it while you wait ▸ Breaker and FVG ranges, T1 and T2, and the invalidation level ▸ Track record — unicorns formed on this chart, the share tapped (bullish and bearish separately), the average bars to the tap, and after the tap the share that reached T1 and T2 and the share that failed with the sweep broken
❹ HOW TO USE IT
A new unicorn appears when the overlapping FVG is found. The zone, the breaker and the FVG are drawn, and the card shows how far price is from the zone.
Check the track record: if zones are rarely tapped on this symbol, a missed retest is normal here.
When price taps the zone, T1, T2 and the invalidation level are drawn. Use your own entry rules for timing and risk.
A sweep into a higher-timeframe level (an old high or low, an order block) is the classic ICT context for a unicorn; that context is part of your own smart money concepts analysis.
Works on forex, gold (XAUUSD), index CFDs and crypto, from 1 minute to the daily chart.
❺ SETTINGS Model ▸ Swing strength — bars on each side that confirm a swing; higher finds bigger, fewer models ▸ Min. liquidity sweep (× ATR) — how far the sweep must run beyond the previous swing ▸ Bars to find the FVG after the MSS — how long the displacement may keep printing the overlapping gap ▸ Min. unicorn zone height (× ATR) — thinner overlaps of breaker and gap are not counted ▸ Bars to wait for the zone tap · Bars after the tap Drawing ▸ Breaker and FVG boxes — show the two parts under the unicorn zone, or the zone alone ▸ Sweep and MSS · Targets and invalidation ▸ Models drawn — how many finished models stay on the chart; the track record keeps all of them ▸ Label size Card ▸ Show card · position (bottom left by default, or any corner) · text size Alerts ▸ Unicorn zone formed · Zone tapped · Target hit / failed Visuals ▸ Neon candles — ice white rising, royal blue falling; the unicorn zone in neon pink. Off = your own chart candles. ▸ Glow candles — each body brightens towards the close. Off = flat neon bodies.
❻ ALERTS ▸ Unicorn zone formed — with the zone ▸ Zone tapped — with T1, T2 and the invalidation level ▸ Target hit, model failed (close beyond the sweep) Create the alert with "Any alert() function call" for the full messages, or use the four alert conditions.
❼ NON-REPAINTING Swings are confirmed pivots, so a sweep is known "swing strength" bars after the swing forms — the model is never drawn before its parts exist. The MSS, the zone, the tap, target hits and failures are decided on closed bars, and no drawing is moved back in time. The script does not use request.security or lookahead.
LIMITATIONS ▸ Swing confirmation delays the model: the MSS can only be registered once the sweep is a confirmed swing, so in a fast move the zone can appear a few bars after price crossed the structure. ▸ The breaker is taken as the last opposite-close candle at the broken swing, and the unicorn needs an FVG that overlaps it. Other traders mark breakers and gaps by eye and may disagree on some of them. ▸ One model is tracked at a time; a unicorn that forms while another is running is not tracked. ▸ The track record covers only the history loaded on your chart, and the "zone tapped" share also counts zones that are still waiting. Small samples are noisy — check how many unicorns formed before trusting a percentage. Past rates are not a forecast. ▸ The model gives a zone, targets and an invalidation level — not an entry. It has no stop loss or position sizing; combine it with your own entry rules and risk management.
This script is for educational purposes only and is not financial advice. Trading involves risk.

Trade setups with clear entry, stop, target and risk logic. Built for traders who want structure, not guessing.
💬 t.me/lunqfx
🌐 lunqfx.com/premium
💬 t.me/lunqfx
🌐 lunqfx.com/premium
คำจำกัดสิทธิ์ความรับผิดชอบ
ข้อมูลและบทความไม่ได้มีวัตถุประสงค์เพื่อก่อให้เกิดกิจกรรมทางการเงิน, การลงทุน, การซื้อขาย, ข้อเสนอแนะ หรือคำแนะนำประเภทอื่น ๆ ที่ให้หรือรับรองโดย TradingView อ่านเพิ่มเติมใน ข้อกำหนดการใช้งาน
Trade setups with clear entry, stop, target and risk logic. Built for traders who want structure, not guessing.
💬 t.me/lunqfx
🌐 lunqfx.com/premium
💬 t.me/lunqfx
🌐 lunqfx.com/premium
คำจำกัดสิทธิ์ความรับผิดชอบ
ข้อมูลและบทความไม่ได้มีวัตถุประสงค์เพื่อก่อให้เกิดกิจกรรมทางการเงิน, การลงทุน, การซื้อขาย, ข้อเสนอแนะ หรือคำแนะนำประเภทอื่น ๆ ที่ให้หรือรับรองโดย TradingView อ่านเพิ่มเติมใน ข้อกำหนดการใช้งาน